ProCap Insights · April 6, 2026
Wall Street's Favorite Story About Layoffs and Stock Prices Is Wrong
The "year of efficiency" narrative says companies that fire workers get rewarded with higher stock prices. We ran the numbers across 34 of the largest tech companies and found the correlation between headcount cuts and stock returns is almost exactly zero. The market pays a product premium, not an efficiency premium.
What to Know
- The four biggest headcount cutters in big tech (META, SHOP, INTC, MSTR) averaged a 181% three-year return, but the nine most aggressive hirers (NVDA, AVGO, CRWD, ANET, DASH, and others) averaged 173%. The gap is 8 percentage points across a 34-company sample with a correlation coefficient of 0.03.
- Palantir grew headcount 15% and returned 1,729% while Adobe grew 7% and lost 36%. The variable that explains returns is not headcount direction but proximity to the AI product cycle.
- The efficiency trade worked as a one-time repricing for a handful of names in 2023. Investors still positioned around the "lean is better" thesis risk buying a narrative that the data no longer supports at scale.
Headcount Change vs. Stock Returns Show No Meaningful Relationship Across 34 Large-Cap Tech Companies
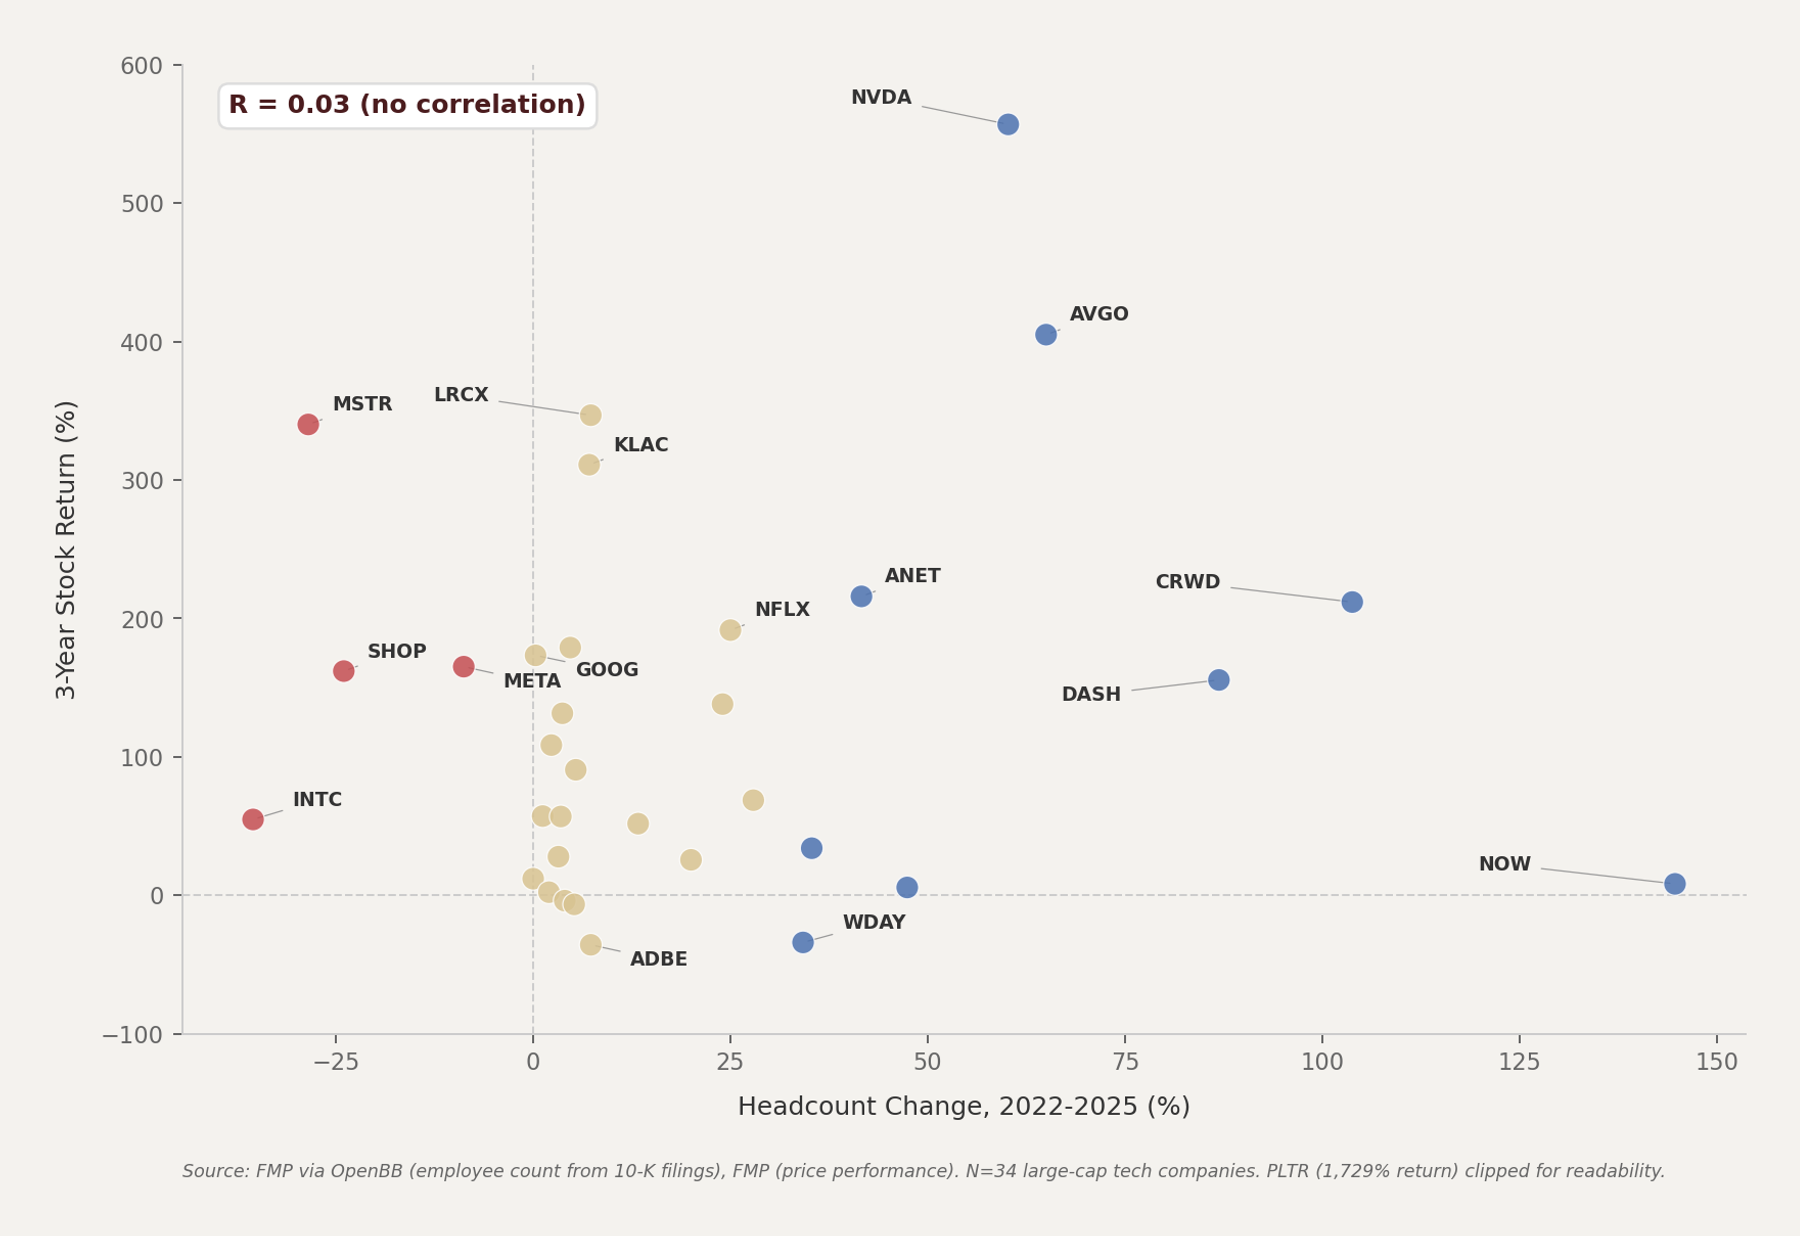
Source: FMP via OpenBB (10-K employee data, price performance). N=34. Period: 2022-2025. PLTR (1,729% return) clipped for readability.
The Myth of the Efficiency Premium
Mark Zuckerberg declared 2023 Meta's "year of efficiency." The company cut 22% of its workforce. The stock tripled.
Wall Street applauded, and a narrative was born. Cut headcount, boost margins, watch the stock rip.
The story was seductive because it confirmed what investors wanted to believe after a decade of big tech bloat. Salesforce cut 10% and nearly doubled. Shopify shed a quarter of its staff and outperformed.
The pattern seemed clear.
It also happened to be a coincidence dressed up as causation. When you expand the sample from the three or four names that anchor the narrative to the 34 largest technology companies by market cap, the relationship between headcount reduction and stock performance evaporates entirely.
What 34 Companies and Three Years of Data Actually Show
The correlation coefficient between headcount change (2022 to 2025, from SEC 10-K filings) and three-year stock return is 0.03. That is statistical noise. There is no linear relationship, no discernible pattern. We find no evidence of an efficiency premium in this 34-stock sample.1
The four companies that cut headcount by more than 5% (Meta, Shopify, Intel, MicroStrategy) averaged a 181% three-year return. The nine companies that grew headcount by more than 30% (Nvidia, Broadcom, CrowdStrike, Arista, DoorDash, Synopsys, Cadence, Workday, ServiceNow) averaged 173%.2
The 21 companies in between, the moderate growers, averaged 174%. All three buckets converge on nearly identical average returns. The "efficiency premium" is an artifact of cherry-picking the three companies where cuts and stock appreciation happened to coincide.
Cutters, Moderate Growers, and Aggressive Hirers All Averaged Nearly Identical Three-Year Returns
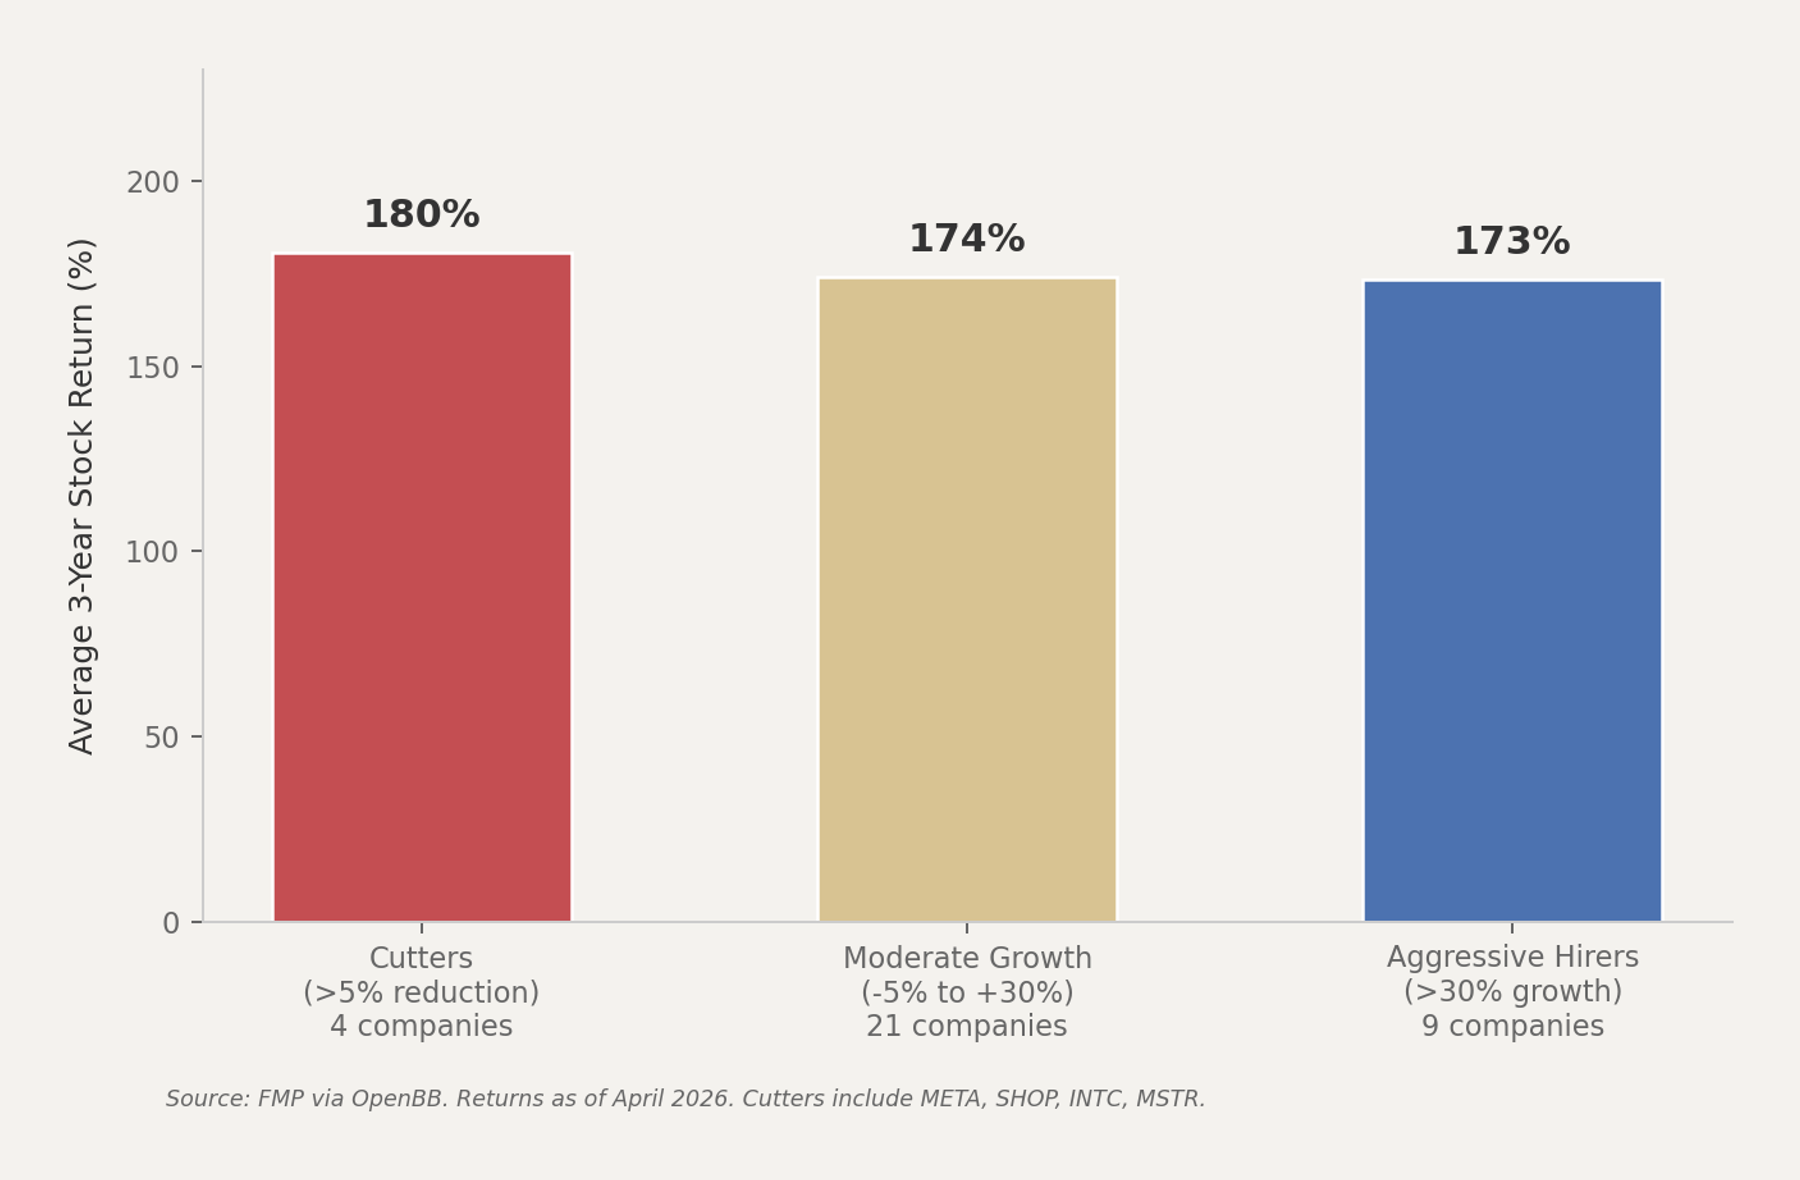
Source: FMP via OpenBB. Average 3-year returns as of April 2026. N=34 companies.
The Meta Illusion and Why It Spread
Meta's turnaround was real. Revenue growth returned at 23% in Q3 2023 after three straight quarters of decline. Operating margins expanded.
The stock surged 178% in calendar year 2023, making it the second-best performer in the S&P 500 behind only Nvidia.3
The mistake was attributing the recovery primarily to headcount cuts rather than to the advertising revenue reacceleration that happened simultaneously. Meta's ad business benefited from a cyclical recovery in digital advertising spend, the collapse of TikTok's growth trajectory, and Reels monetization catching up to feed monetization.
The cuts helped margins. The revenue growth drove the multiple expansion.
By 2025, Meta had started rehiring. Headcount climbed from 67,317 at the trough back to 78,865. The "year of efficiency" became a chapter, not a permanent operating philosophy.
The stock has returned just 11% over the past year as headcount crept back up and capex surged toward AI infrastructure.
Meta Cut 22% of Its Workforce in 2023, Then Quietly Started Rehiring
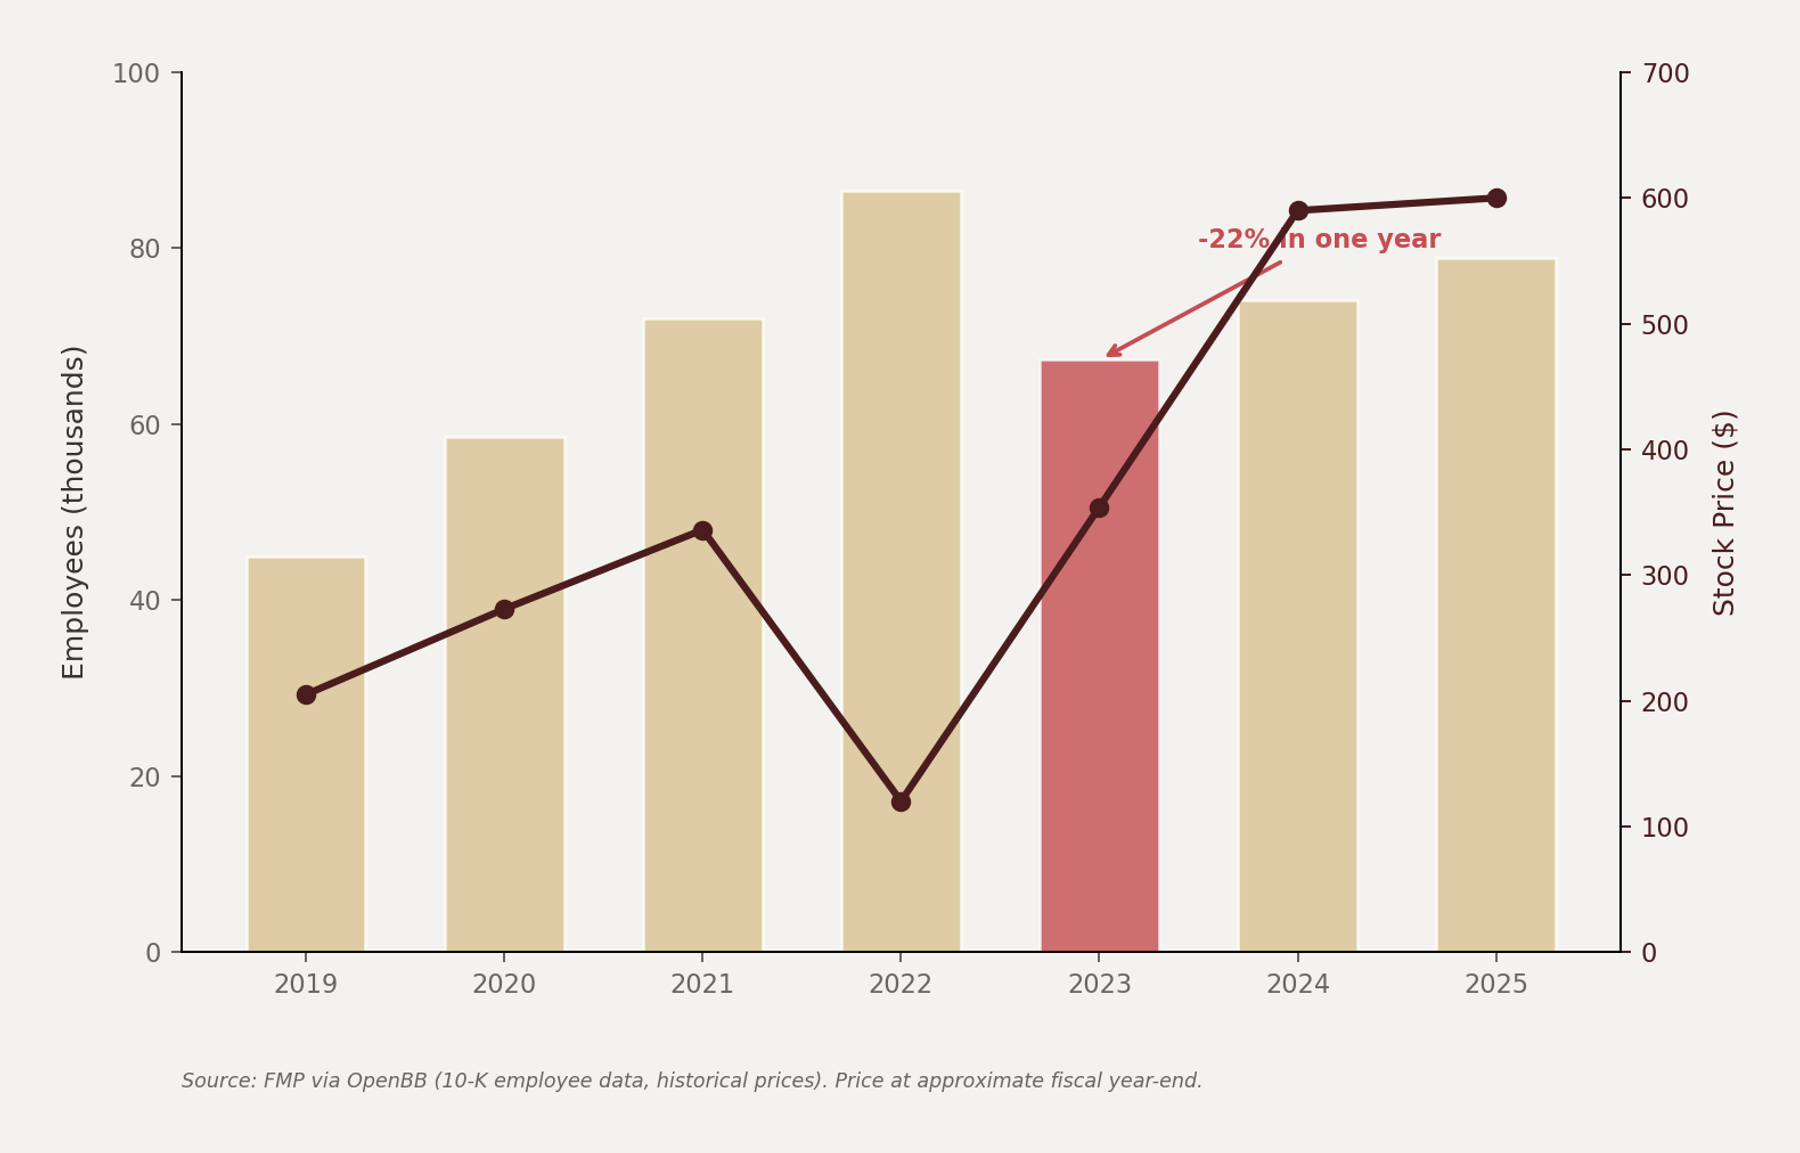
Source: FMP via OpenBB. Employee counts from 10-K filings. Stock prices approximate fiscal year-end.
Product Cycle Matters More Than Headcount
The top-performing stocks in the sample share one trait that has nothing to do with layoffs. They all sit at the center of the AI infrastructure buildout.
Nvidia grew headcount 60% and returned 557%. Broadcom grew 65% and returned 405%. Lam Research grew 7% and returned 347%.4
The worst performers share a different commonality. They missed or were late to the AI cycle. Adobe grew headcount 7% and lost 36%.
Workday grew 34% and lost 34%. CRM grew 4% and lost 4%. Headcount direction did not reliably predict returns in our sample.
Palantir is the most extreme example. It grew headcount a modest 15% and delivered a 1,729% three-year return. The driver was not efficiency.
It was a government and enterprise AI platform that went from niche to essential. No amount of workforce restructuring produces that kind of return.
The Top 12 Performers Include Companies That Cut, Held Steady, and Hired Aggressively
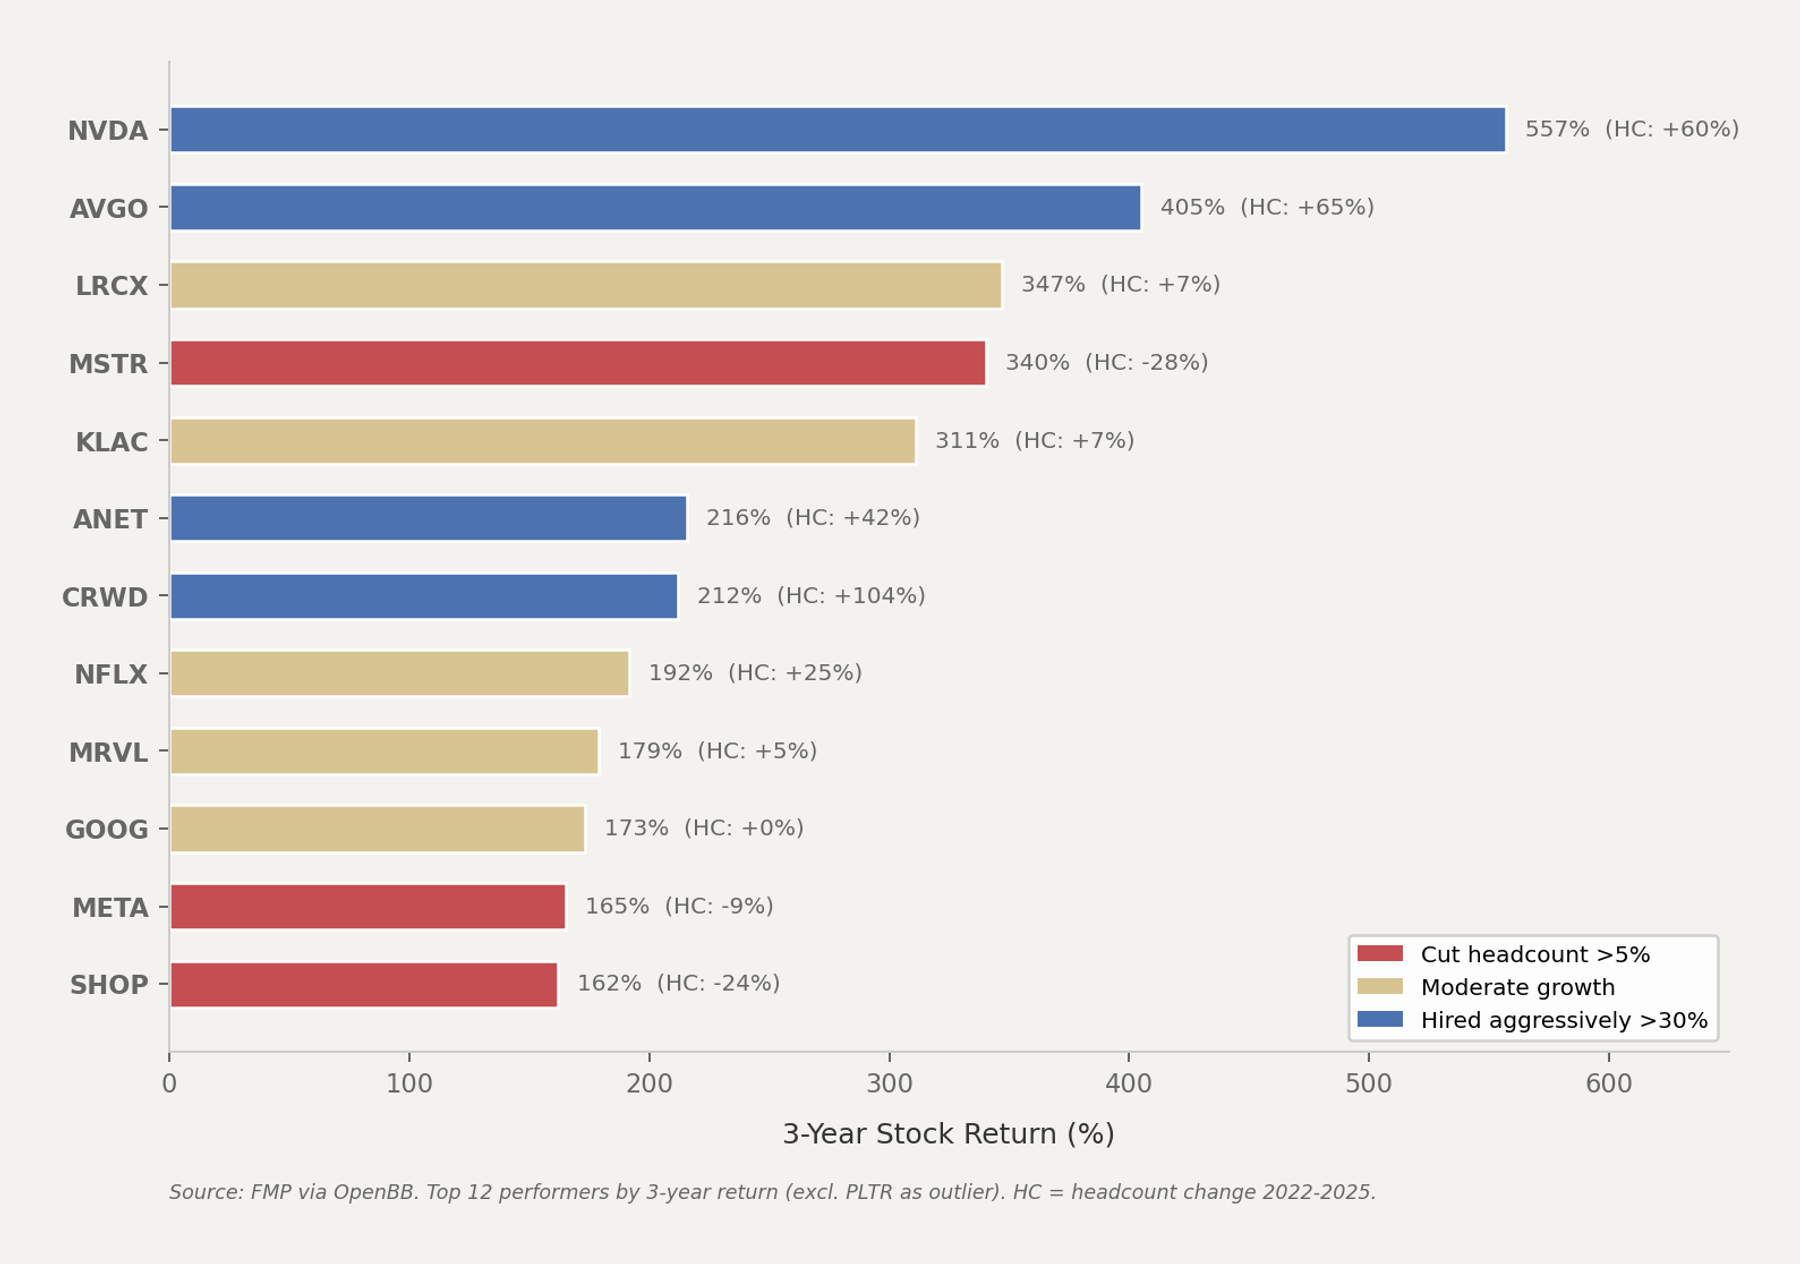
Source: FMP via OpenBB. Top 12 by 3-year return (excl. PLTR as outlier). HC = headcount change 2022-2025.
The Consensus and Where It Breaks
The dominant Wall Street narrative still treats operational efficiency as a primary driver of tech stock outperformance. Analyst notes routinely cite "leaner operations" and "margin discipline" as bull case catalysts. The efficiency framing persists because it provides a simple, repeatable story for why certain stocks went up.
Our data suggests the narrative is backwards in this cohort. Companies did not outperform because they cut workers. Companies that happened to cut workers during a simultaneous revenue reacceleration (META) or a product repricing event (SHOP pivoting back to core commerce) got credited for an efficiency trade that was actually a revenue trade.
Intel cut 36% of its workforce and returned 55% over three years. That sounds like a win until you compare it to Nvidia, which added 60% more employees and returned ten times as much.
The efficiency framework cannot explain this gap. The product framework can. Intel is restructuring a declining franchise while Nvidia is scaling the most important product cycle in a generation.
The Counter-Argument
The strongest case for the efficiency premium is that it works as a catalyst for specific companies at specific moments, not as a market-wide factor. Meta's cuts in 2023 were a genuine operational reset that restored investor confidence in Zuckerberg's capital allocation discipline. The stock responded to a real change in management philosophy, not just a headcount number.
There is also a timing argument. Companies that cut early in 2022-2023 captured the benefit before this analysis window fully captures the re-rating. By measuring 2022-2025, the window includes the post-cut rally but also the subsequent normalization.
A tighter window around the announcement date of major layoffs might show a more pronounced short-term effect.
The selection bias argument also deserves consideration. The 34 largest tech companies by market cap are survivors. They can afford to cut or hire because they already have dominant market positions.
The efficiency premium might be more visible in mid-cap or small-cap technology names where margin improvement is the primary available lever for re-rating, since these companies cannot rely on AI infrastructure tailwinds.
Finally, some cuts are genuinely strategic. When Shopify shed 20% of its workforce and refocused on core commerce, that was not just cost reduction. It was a product strategy change that removed the drag of unprofitable experiments.
The subsequent 162% return reflected a leaner, more focused business, not just a smaller payroll. The difficulty is distinguishing this from the broader narrative, which incorrectly applies the same logic to every company that announces layoffs.
Key Data Table
| Ticker | HC 2022 | HC 2025 | HC Change | 3-Yr Return | 1-Yr Return |
|---|---|---|---|---|---|
| NVDA | 22,473 | 36,000 | +60% | +557% | +82% |
| AVGO | 20,000 | 33,000 | +65% | +405% | +104% |
| MSTR | 2,152 | 1,539 | -28% | +340% | -52% |
| LRCX | 17,700 | 19,000 | +7% | +347% | +255% |
| KLAC | 14,000 | 15,000 | +7% | +311% | +155% |
| ANET | 3,612 | 5,115 | +42% | +216% | +85% |
| CRWD | 4,965 | 10,118 | +104% | +212% | +23% |
| NFLX | 12,800 | 16,000 | +25% | +192% | +14% |
| MRVL | 6,729 | 7,042 | +5% | +179% | +115% |
| GOOG | 190,234 | 190,820 | +0.3% | +173% | +99% |
| META | 86,482 | 78,865 | -9% | +165% | +11% |
| SHOP | 10,000 | 7,600 | -24% | +162% | +51% |
| DASH | 16,800 | 31,400 | +87% | +156% | -7% |
| AMD | 25,000 | 31,000 | +24% | +138% | +163% |
| UBER | 32,800 | 34,000 | +4% | +131% | +10% |
| INTC | 131,900 | 85,100 | -36% | +55% | +159% |
Sources listed in endnotes.5
Catalyst Map
Q2 2026 earnings season (July-August) will test whether AI infrastructure spending remains elevated. If Nvidia, Broadcom, and the semiconductor equipment names (LRCX, KLAC) guide higher, the product-cycle thesis strengthens further. A spending deceleration would narrow the performance gap between hirers and cutters.
The Fed holds rates at 3.50-3.75% with a 94.8% probability of no change at the April FOMC meeting.6 A rate cut later in 2026 would disproportionately benefit growth names that hired aggressively, as their higher operating leverage amplifies the margin benefit of cheaper capital.
Meta's next 10-K filing (early 2027 for fiscal 2026) will reveal whether headcount continues creeping higher. If Meta's employee base returns to 85,000+ while the stock underperforms, it will further erode the efficiency narrative.
The Bottom Line
The "efficiency premium" in big tech is a sample-size-of-three illusion. Across 34 large-cap technology companies, headcount direction shows a 0.03 correlation with three-year stock returns. The counter-argument that targeted cuts work as specific catalysts at specific companies is real, but the variable that separates the 500% winners from the 30% laggards is proximity to the AI product cycle through 2027, not headcount direction.
Sources
1. FMP via OpenBB MCP. Employee count data from SEC 10-K filings for 34 companies. Price performance data from FMP. Correlation computed on headcount change (2022-2025) vs. 3-year stock return. Retrieved April 6, 2026.
2. FMP via OpenBB. Category averages computed across cutters (n=4), moderate growers (n=21), aggressive hirers (n=9). Cutoff thresholds: cutters >5% reduction, aggressive hirers >30% growth.
3. CNBC, "Meta's stock is wrapping up a record year, spurred by cost cuts that followed a disastrous 2022," December 18, 2023. Yahoo Finance, "Layoffs: Tech's year of efficiency continues," 2024.
4. FMP via OpenBB. Three-year price performance as of April 6, 2026. Employee counts from most recent 10-K filings.
5. FMP via OpenBB. All figures from Tier 0 API data. Table shows 16 of 34 companies sorted by 3-year return.
6. CME FedWatch Tool, April 2026. Federal Funds Target Rate at 3.50-3.75%. Hold probability 94.8% for April 29-30 FOMC meeting.