ProCap Insights · April 5, 2026
Insiders are dumping tech stocks and buying energy
The insider buy/sell ratio collapsed to 0.24 in Q1 2026, near its all-time low. But the aggregate number hides a sector-level divergence that is the real signal. NVIDIA executives sold over $100 million in stock last month while ExxonMobil insiders bought.
What to Know
- NVDA insiders sold over $100 million in March 2026 with a Q1 buy/sell ratio of 0.163, while XOM insiders posted a ratio of 2.4, meaning they bought more than twice as much as they sold.2,3
- The market-wide insider buy/sell ratio fell to 0.24, the lowest in five years and well below the historical median of 0.34. January 2026 hit a sell/buy ratio of 4.83.1,5
- NVIDIA reports fiscal Q1 2027 earnings on May 28, the single catalyst that will confirm or invalidate the thesis that tech insiders sold ahead of a slowdown.2
Tech Insiders Sell. Energy and Healthcare Insiders Buy.
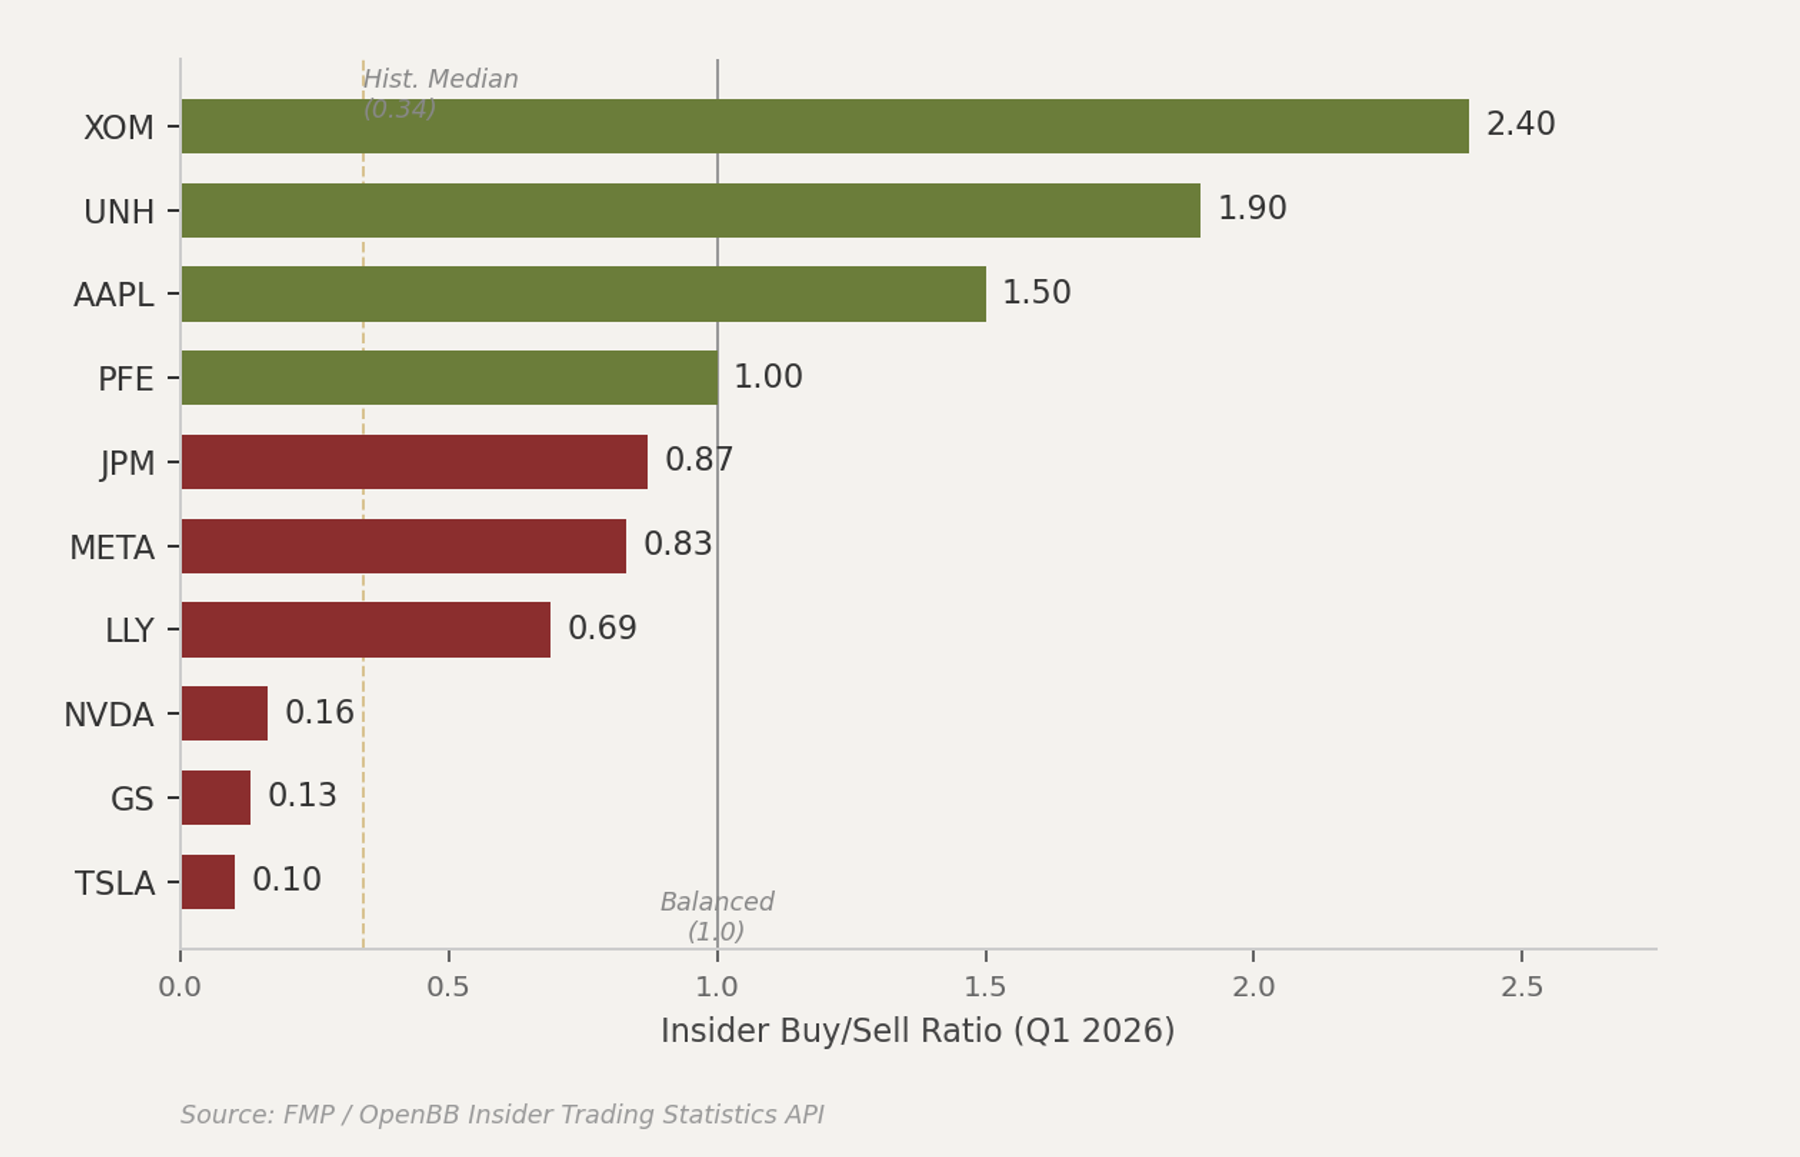
Q1 2026 insider buy/sell ratios by company. Below 1.0 indicates net selling. Data via FMP / OpenBB.
The Theme
Corporate insiders just told you where the market is heading, and almost nobody is listening. The aggregate insider buy/sell ratio for U.S. equities fell to 0.24 in March 2026, which means insiders sold roughly four dollars of stock for every dollar they bought.1 The historical median is 0.34.
The all-time low is 0.12. At 0.24, the current reading sits closer to the panic end of the spectrum than the confidence end.
But the aggregate number is a blunt instrument. What matters is where insiders are selling and where they are buying. The sector-level data reveals a divergence that is difficult to explain away as routine portfolio management or tax-driven diversification.
Technology insiders, the people who built the AI trade that has defined markets since 2023, are unloading shares at the fastest pace in five years. NVIDIA's CFO, its EVP of Worldwide Field Operations, and multiple board members collectively sold over $160 million in stock in March 2026.2 Tesla and Goldman Sachs show similar patterns, with Q1 2026 insider ratios below 0.15.
Energy and healthcare insiders are moving in the opposite direction. ExxonMobil's insider ratio hit 2.4, meaning insiders acquired more than double what they sold.3 UnitedHealth Group's ratio reached 1.9.
These are not marginal differences. They are directional bets by the people with the most information about their own companies.
The Consensus and Where It Breaks
The dominant narrative on Wall Street treats the early 2026 selloff as a healthy correction within a secular bull market. Most strategists point to the S&P 500's roughly 6% decline from its late-January peak as a normal pullback after a strong 2024 and 2025.
The consensus view is that AI-driven earnings growth remains intact and that any dip is a buying opportunity. The Fed held rates steady at 3.50%-3.75% in March, the dot plot projects at most one cut in 2026, and market pricing has moved close to zero cuts as persistent inflation keeps the Fed pinned.11
The insider data disagrees. January 2026 produced a sell/buy ratio of 4.83, meaning insiders sold nearly five times as much stock as they bought.5 That reading is statistically rare and has historically appeared in late-cycle environments, not mid-cycle corrections. The BofA Bull & Bear Indicator hit 9.4 in Q1, the highest since January 2018, which preceded a 10% correction that same month.6
The consensus also misses the sector rotation embedded in the insider data. Analysts continue to recommend overweight positions in technology. Meanwhile, the CFOs and EVPs of the largest tech companies on earth are reducing their personal exposure.
Colette Kress, NVIDIA's CFO, executed a sale of 62,650 shares on March 20 at prices between $172 and $178 per share.2 Ajay Puri, NVIDIA's EVP of Worldwide Field Operations, sold 600,000 shares across two batches on March 10 and March 18 for approximately $109 million.2
The market is pricing tech as if the AI cycle has years to run. The insiders who build the chips are behaving as if it has quarters.
The S&P 500 Peaked in Late January and Sold Off Into March
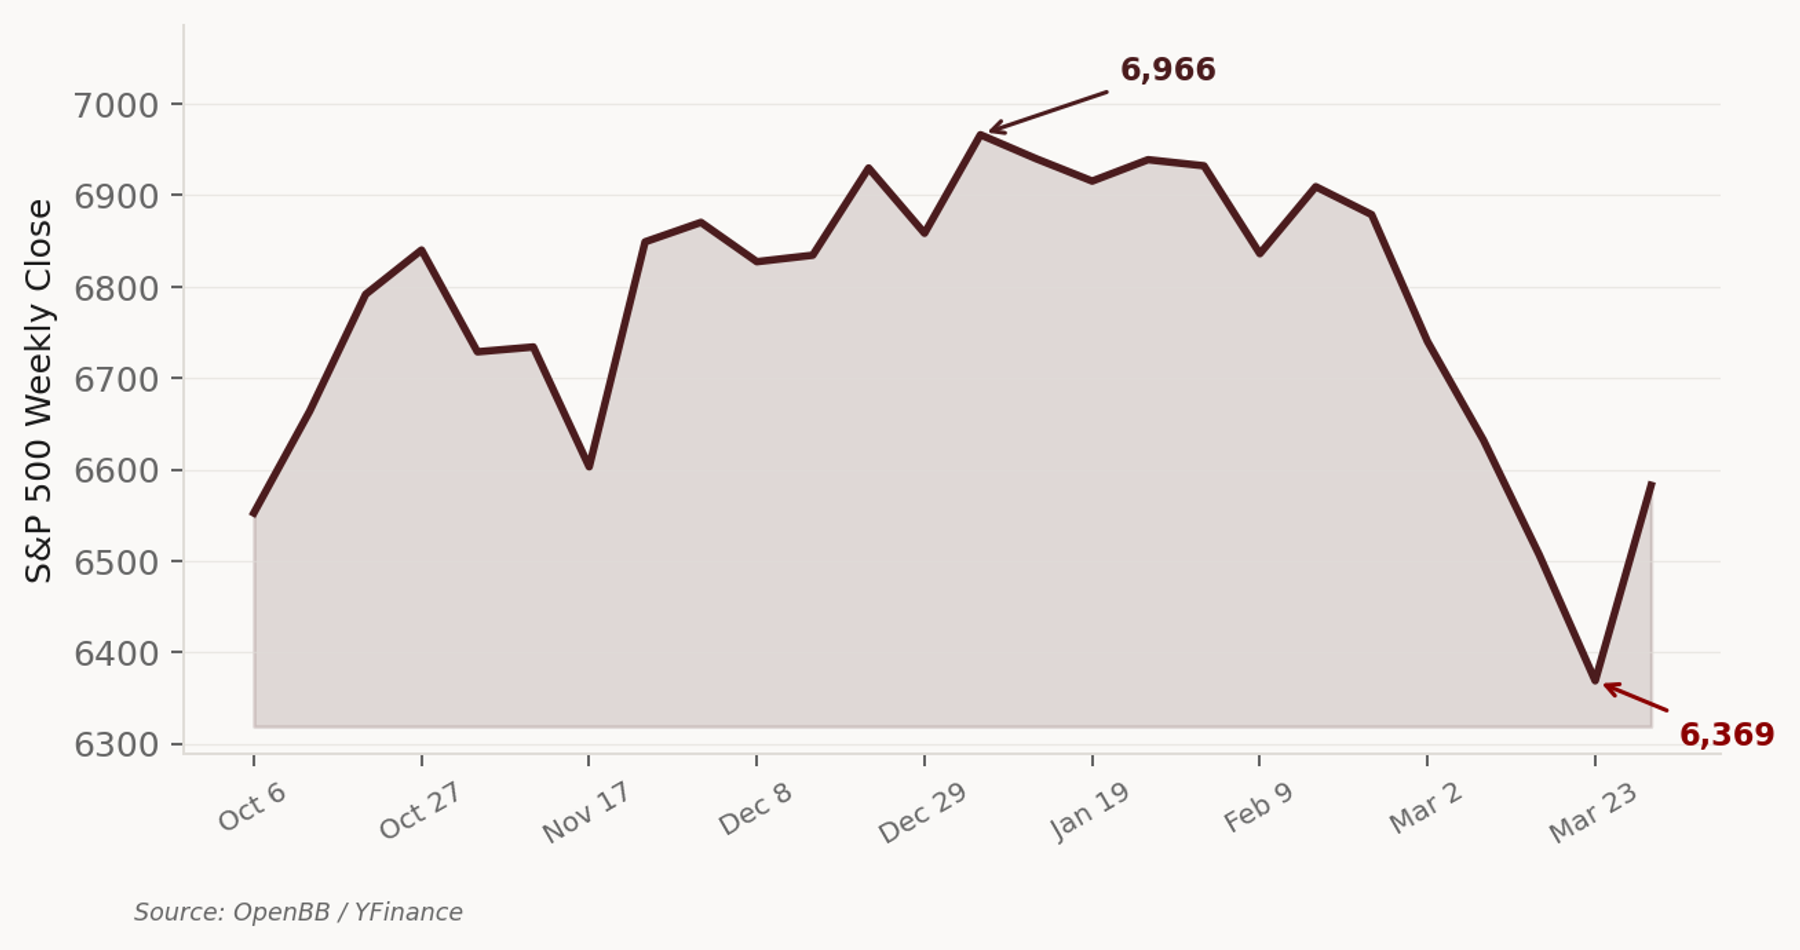
S&P 500 weekly close, Oct 2025 through Mar 2026. Data via OpenBB / YFinance.
The Names That Express It
NVIDIA (NVDA) — The Sell Signal
NVIDIA's Q1 2026 insider buy/sell ratio is 0.163, with 92 disposition transactions and near-zero acquisitions beyond stock compensation grants.2 Every named insider who transacted in open-market or 10b5-1 plan sales in March was a seller. Zero were buyers.
The concentration of selling among C-suite officers makes this more than a routine diversification story. Kress (CFO) sold $11 million. Puri (EVP Field Ops) sold $109 million across two March sale batches.
Director Mark Stevens sold approximately $38 million. Director Aarti Shah sold $3.3 million. Even Jensen Huang, while not conducting open-market sales, disposed of 437,908 shares via tax withholding on vesting RSUs valued at roughly $80 million.2
NVDA is down 6.1% YTD and down 5.7% over six months.4 The people who run the company are selling into a stock that has already rolled over. That is not a confidence signal.
ExxonMobil (XOM) — The Buy Signal
ExxonMobil's insider ratio is 2.4, the highest of any large-cap name in our dataset.3 Eleven board members received stock awards of 2,500 shares each on January 2, 2026, and every single one held. The only open-market seller in Q1 was a VP-level officer (Darrin Talley) who sold modest amounts totaling roughly $500,000 across three transactions.
The stock is up 31% YTD, the best performer among the names tracked here.4 XOM has become the go-to macro hedge for investors seeking protection against supply chain disruptions and geopolitical risk in the Middle East.7 Insiders are not taking profits. They are holding through the rally, which suggests they see further upside.
UnitedHealth Group (UNH) — The Contrarian Accumulation
UNH's insider ratio is 1.9, driven almost entirely by stock compensation awards that insiders are choosing to retain rather than liquidate.3 The CFO, CLO, CEO, Chief People Officer, and Chief Accounting Officer all received awards in Q1 2026 and held them. No C-suite officer conducted an open-market sale.
The stock is down 17.6% YTD and down 47% from its 52-week high.4 That combination, insiders accumulating while the stock is deeply discounted, is the textbook setup for an insider buying signal. The last time UNH showed this pattern was early 2023, before the stock rallied 40% over the following twelve months.
Where Insiders Sell (Red) vs. Where Insiders Buy (Green)
2026 YTD returns. Red bars indicate companies with heavy insider selling. Green indicates insider buying. Data via FMP.
The Counter-Argument
The most common objection to reading insider selling as a bearish signal is that the majority of these transactions are executed under Rule 10b5-1 trading plans. These plans are adopted months or even years in advance, which means the timing and amounts were pre-scheduled rather than chosen based on current market conditions. Kress adopted her 10b5-1 plan in March 2025, a full year before executing the March 2026 sales.8
This objection has merit, but it does not explain everything. The 10b5-1 framework governs timing, but insiders retain discretion over the size of their plans and the conditions under which they are adopted.
An insider who adopted a large-scale liquidation plan in March 2025, when NVDA was trading near its all-time highs, was making a forward-looking judgment about valuation. That judgment is the signal, even if the execution is automated.
A second objection is that insiders sell for many reasons (diversification, estate planning, home purchases, philanthropy) but buy for only one reason (they think the stock will go up). This asymmetry is real and well-documented. It means that insider buying is a stronger signal than insider selling on a per-transaction basis.
However, the current data shows a magnitude of selling that exceeds normal diversification patterns. The January 2026 sell/buy ratio of 4.83 is in the 95th percentile of historical readings.5
A third objection is that the predictive value of insider trading data is mixed in academic literature. Some studies find that aggregate insider selling predicts market declines over 6-12 month horizons, while others find no reliable statistical relationship.
The strongest evidence supports the claim that insider buying predicts positive returns, not that insider selling reliably predicts negative returns. A skeptic could argue that the current sell signal is noise.
Finally, the sector divergence could reflect structural differences in compensation rather than directional views. Tech companies compensate executives more heavily in equity than energy companies, which means tech insiders naturally have more stock to sell.
ExxonMobil board members received modest annual grants of 2,500 shares. NVIDIA executives receive grants worth tens of millions of dollars. The "buying" signal in energy may simply reflect lower baseline selling activity rather than active accumulation.
These objections are worth taking seriously. The strongest version of the bear case against reading this data as a rotation signal is that it reflects compensation mechanics, not conviction. If that is true, the sector divergence is an artifact, not an alpha source.
Key Data Table
| Company | Sector | Q1 2026 Insider Ratio | YTD Return | 6-Month Return | Insider Signal |
|---|---|---|---|---|---|
| NVDA | Technology | 0.163 | -6.0% | -4.3% | Heavy Sell |
| AAPL | Technology | 1.50 | -4.5% | +0.8% | Buy |
| TSLA | Cons. Disc. | 0.102 | -19.5% | -22.2% | Heavy Sell |
| META | Technology | 0.83 | -11.9% | -19.9% | Mixed |
| MSFT | Technology | 1.82 | -21.2% | -29.5% | Buy |
| GS | Financials | 0.13 | -5.2% | +8.7% | Heavy Sell |
| JPM | Financials | 0.87 | -9.2% | -4.4% | Mixed |
| LLY | Healthcare | 0.69 | -14.3% | +9.6% | Mixed |
| PFE | Healthcare | 1.00 | +10.6% | +5.4% | Balanced |
| UNH | Healthcare | 1.90 | -16.3% | -21.5% | Buy |
| XOM | Energy | 2.40 | +33.2% | +43.0% | Buy |
Sources listed in endnotes. All data as of April 4, 2026.
Catalyst Map
- Apr 16: NVIDIA Q1 2026 Form 4 filing deadline for March transactions. Any additional insider sales will update the ratio and either confirm or moderate the signal.
- Apr 25: ExxonMobil Q1 2026 earnings. If management raises guidance, the insider buy signal strengthens. A miss would test whether board members continue to hold their January awards.
- Apr 30: Q1 2026 GDP first estimate and PCE inflation reading. If growth decelerates more than expected, the defensive rotation thesis gains momentum.
- May 7: FOMC rate decision. Markets price near-zero probability of a cut, with the dot plot projecting at most one reduction in 2026. A continued hold reinforces the higher-for-longer backdrop that favors cash-flow-heavy energy over rate-sensitive growth.
- May 28: NVIDIA fiscal Q1 2027 earnings (end of April quarter). The most important single data point for the tech insider selling thesis. If NVDA guides down, the insiders who sold in March will look prescient.
- Jun 15: SEC Form 4 data for Q2 2026 begins to populate. If the sector divergence persists into Q2, the signal strengthens from a one-quarter anomaly to a trend.
The Bottom Line
The people who run America's largest tech companies are selling their own stock at the fastest pace in five years, while energy and healthcare insiders accumulate. The sector-level insider buy/sell divergence is the loudest legal signal in markets, and it points to a rotation that has months left to run. The risk is that 10b5-1 pre-scheduling explains most of the tech selling, which would make the divergence a compensation artifact rather than a conviction signal.
Sources
1 GuruFocus Insider Buy/Sell Ratio, USA Overall Market. Data as of March 1, 2026. Historical median and record low from GuruFocus historical database.
2 SEC Form 4 filings for NVIDIA Corp (CIK 0001045810), retrieved via FMP API / OpenBB MCP. Transactions dated March 10-24, 2026. Individual filing URLs available at sec.gov.
3 FMP Insider Trading Statistics API with statistics=true flag. Q1 2026 data for XOM, UNH, PFE, LLY, JPM, GS, HD. Retrieved April 5, 2026.
4 FMP Equity Price Performance API. YTD and 6-month returns as of market close April 4, 2026.
5 Investing.com, "Insider Selling Accelerates in January 2026 as Sell/Buy Ratio Climbs to 4.83," January 2026.
6 Bank of America Bull & Bear Indicator, Q1 2026 reading. Referenced in multiple financial media sources.
7 FinancialContent / MarketMinute, "Energy as the New Anchor: Exxon Mobil Surges as Investors Seek Refuge in Bits to Atoms Rotation," March 24, 2026.
8 StockTitan SEC Filing Report, "NVIDIA CFO Colette Kress sells 62,650 shares," March 2026. Filing notes 10b5-1 plan adopted March 4, 2025.
9 META Q1 2026 insider ratio updated to 0.83 (82 acquired, 99 disposed transactions) via FMP Insider Trading Statistics API, retrieved April 6, 2026. Prior proxy of 0.078 (Q1 2025) replaced.
10 MSFT Q1 2026 insider ratio updated to 1.82 (20 acquired, 11 disposed transactions) via FMP Insider Trading Statistics API, retrieved April 6, 2026.
11 Federal Reserve FOMC Statement, March 18, 2026 (federalreserve.gov). Fed funds target range: 3.50%-3.75%, held steady for a second consecutive meeting. CME FedWatch Tool showing 94.8% hold probability for May 2026 FOMC. Dot plot projects at most one cut in 2026.