ProCap Insights · April 20, 2026
2 trades for the rare S&P 500 signal that's historically led to a 33% rally within a year
Three consecutive weeks of +3% gains has happened exactly three times in 76 years. The first two launched some of the most powerful bull runs in American market history, delivering an average +33.4% price return over the following twelve months. Here's how to play it.
What to Know
- The data favors going long broad equities through the equal-weight S&P 500 (RSP) and small-caps (IWM) over a 3-to-12-month horizon. The two prior signals produced average forward price returns of +10.2% at three months, +20.5% at six months, and +33.4% at twelve months.
- Every prior instance coincided with a violent sentiment reversal from peak fear to peak greed. The Nasdaq just completed the fastest oversold-to-overbought RSI swing on record, covering in 11 trading days what historically takes months.
- The critical variable is whether breadth continues expanding beyond megacap tech, and the next four weeks of Q1 earnings will determine if this rally has an earnings floor or is running on air.
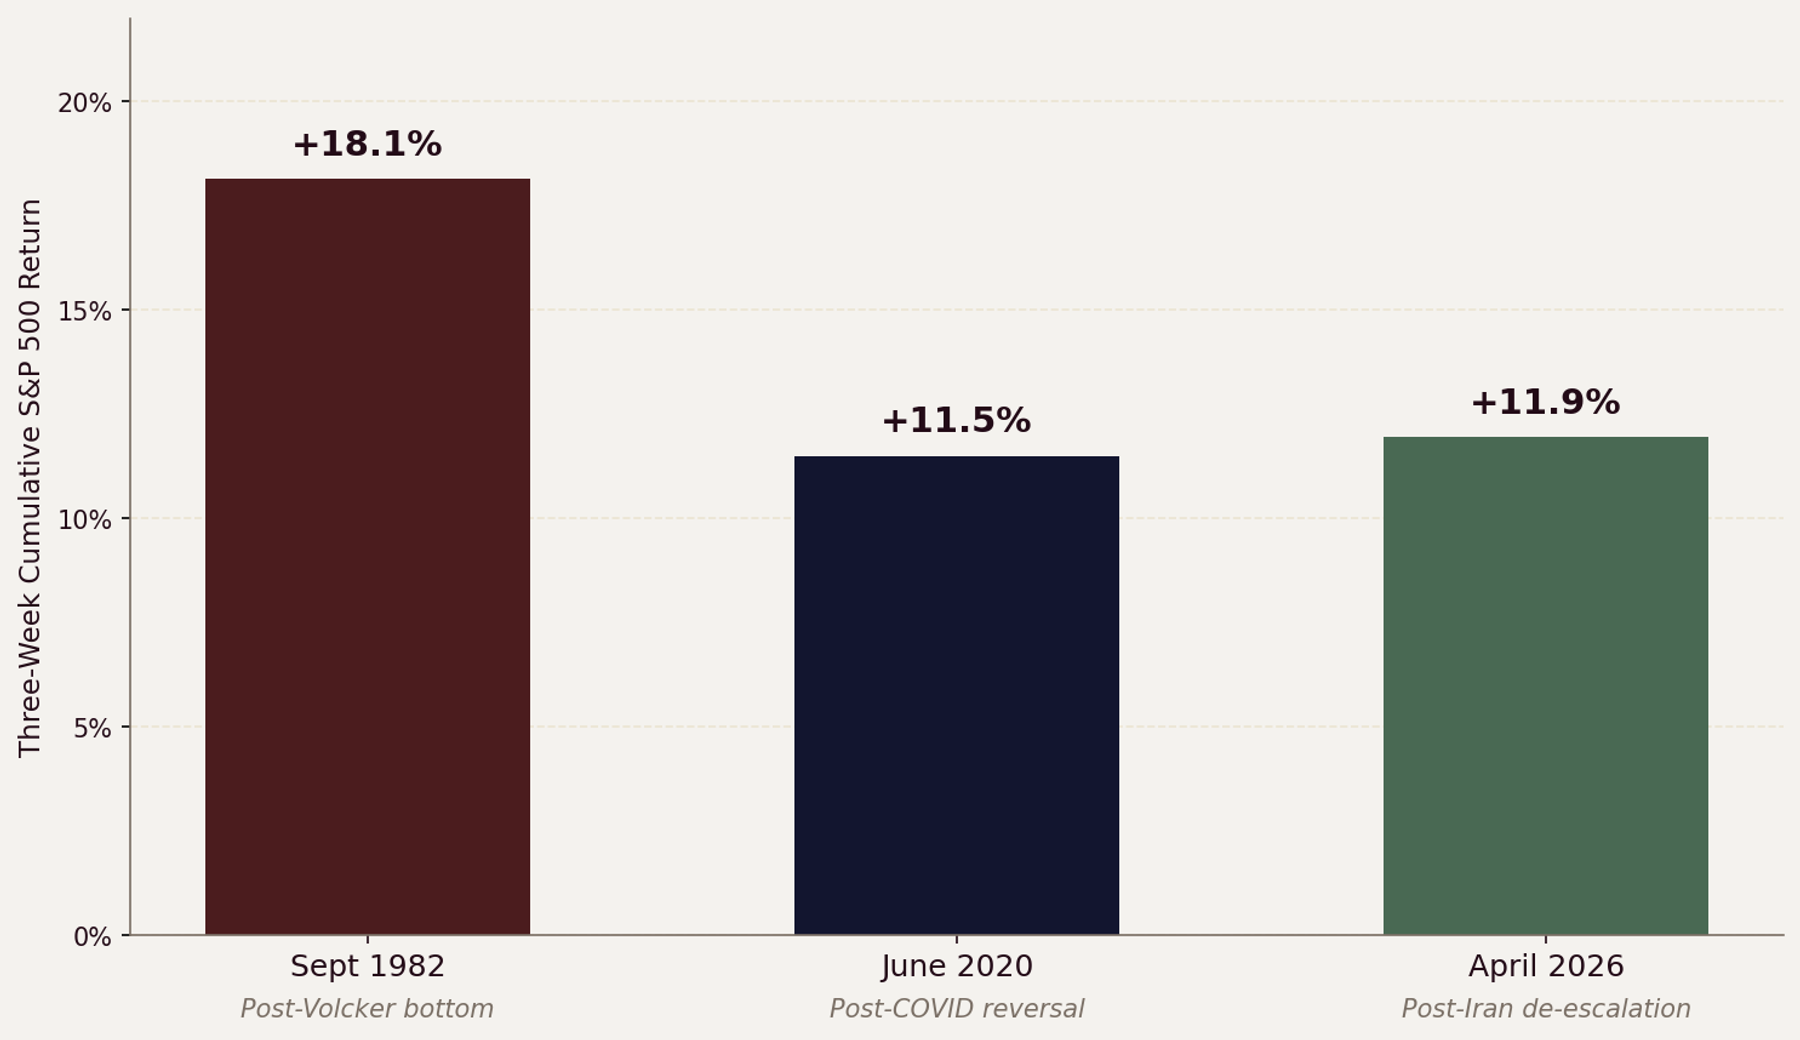
Only Three Times in 76 Years Has the S&P Posted Three Straight +3% Weeks
Source: S&P Dow Jones Indices, ^GSPC daily closes via OpenBB (as of April 17, 2026)
The Rarest Signal in Market History
The S&P 500 gained 3.36% the week ending Friday April 3, followed by 3.56% the week ending April 10, and then 4.54% the week ending April 17.
That cumulative three-week run of approximately 11.9% is only the third time since 1950 the index has strung together three consecutive weekly gains of +3% or more.1
The first instance ended the week of September 3, 1982. The S&P had bottomed at 102.42 on August 12, following years of stagflation and a brutal double-dip recession. Paul Volcker had finally begun cutting the discount rate, and the index rallied +18.1% over those three weeks — a more violent thrust than the current run.2
The second instance ended the week of June 5, 2020. The market had crashed 33.9% in 23 trading days during the COVID panic, then ripped roughly 40% off the March 23 low in what became the greatest 50-day rally in S&P history.
The three-week thrust into June 5 totaled +11.5%, nearly identical in magnitude to the current move.3
The current instance emerges from a different catalyst but an identical pattern. The S&P spent weeks pricing in escalating geopolitical risk from the Iran conflict, with the Strait of Hormuz closure threatening global oil supply. Ceasefire hopes, followed by Iran declaring the Strait open, reversed the fear premium with breathtaking speed.4
The pattern across all three is the same.
A period of intense, concentrated fear gets abruptly resolved, and the weight of sidelined capital floods back into equities faster than anyone expects.
Wall Street Thinks the Easy Money Has Been Made. History Disagrees.
The prevailing sell-side view right now is some version of “take profits here.” The S&P just hit a new all-time high of 7,126.05 on April 17. The Nasdaq has posted 13 consecutive winning sessions, the longest streak since January 1992 per Dow Jones Market Data.5
RSI readings have swung from oversold to overbought in 11 trading days, the fastest such transition since the early 1980s.
That looks like a setup for a pullback, and most strategists are saying exactly that.
The consensus is that the Iran peace premium has been fully priced, that the rally is technically exhausted, and that investors should wait for a better entry.
The historical record says something different.
After the September 1982 signal, the S&P gained +13.1% over the following three months, +25.1% over six months, and +34.5% over twelve months on a price-return basis.6
That three-week burst was not the end of the move. It was the beginning of a five-year bull market that delivered +229% in price returns.
After the June 2020 signal, the S&P gained +7.3% over the next three months, +15.8% over six months, and +32.3% over the following year. The COVID rally did experience a 9.6% correction in September 2020 — peaking at 3,580.84 on September 2 and falling to 3,236.92 by September 23 — before resuming its climb to new highs.7
The pullback happened. It did not break the trend.
The average 12-month forward price return after this signal is +33.4%.
The consensus view that “easy money has been made” was equally popular after both prior signals. It was wrong both times.
Both Prior Instances Delivered Double-Digit Forward Returns at Every Horizon
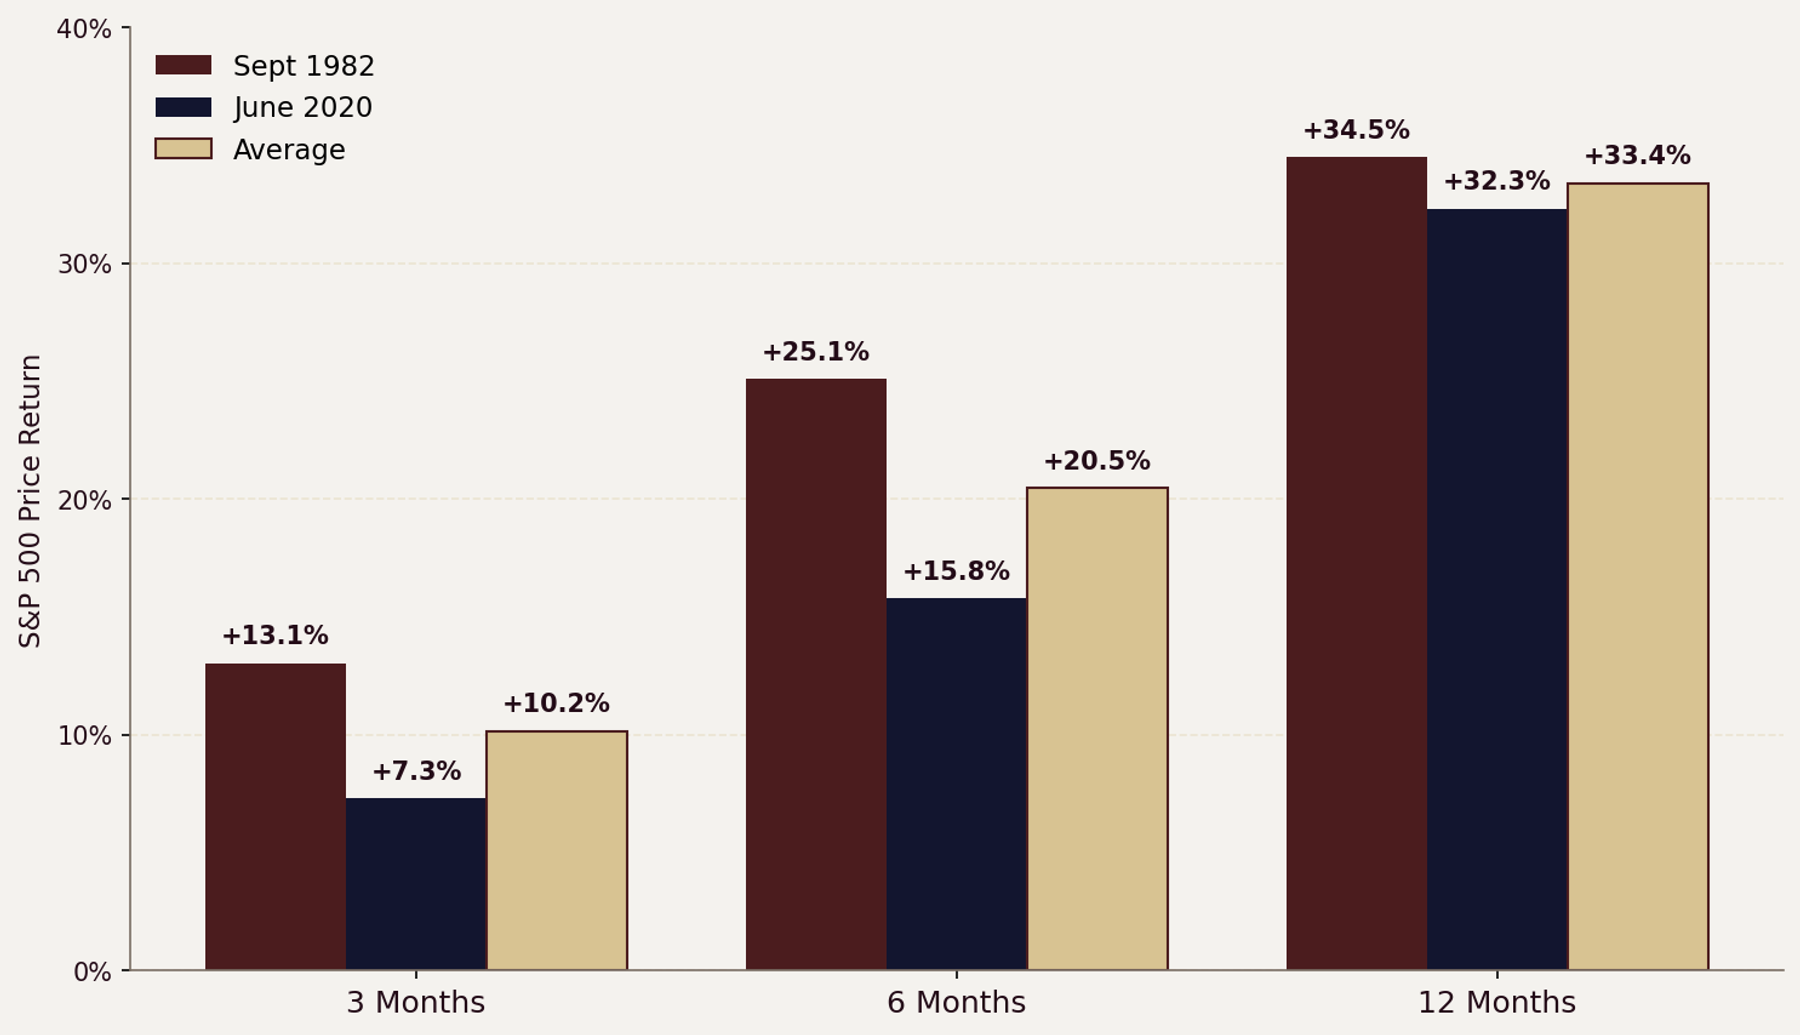
Source: S&P Dow Jones Indices, ^GSPC daily closes via OpenBB. Figures shown are price returns; total returns with dividends would add approximately 3-6 ppts to the 1982 12-month figure and approximately 1-2 ppts to the 2020 12-month figure.
Two Trades That Position for What Comes Next
Trade 1. Long Equal-Weight S&P 500 (RSP) for 3 to 6 Months
The Invesco S&P 500 Equal Weight ETF (RSP) is the cleanest expression of the breadth expansion trade. In both prior instances, the initial rally was narrow, driven by a handful of large-cap names.
The subsequent 6-to-12-month move was broad, powered by the rest of the index catching up.
In 1982, the first phase was dominated by financials and rate-sensitive names. By early 1983, industrials, energy, and consumer stocks had joined the move, and the equal-weight approach outperformed.
In 2020, the initial rally was all megacap tech. By late 2020 and into 2021, the “reopening trade” broadened participation dramatically.
The same setup exists today. The Magnificent Seven ETF (MAGS) has gained 13.2% in April month-to-date, and Microsoft rallied 13.3% in just four trading days from its April 10 close.
That concentration of returns in megacap names creates the exact conditions where equal-weight outperforms as the rally broadens.
RSP trades at roughly $203 per share as of the April 17 close, and the setup favors adding exposure here with a 3-to-6-month time horizon.
Trade 2. Long Small-Caps (IWM) for 6 to 12 Months
The iShares Russell 2000 ETF (IWM) at $275.78 targets the highest-beta segment of the fear reversal. Small-caps have bounced approximately 15% from their March 30 low of $239.61 but still lag the S&P 500 recovery on a relative basis.8
After the 1982 signal, small-caps outperformed large-caps by roughly 15 percentage points over the following twelve months. The small-cap value factor delivered some of its best relative performance of the decade in the 12 months following the August 1982 bottom.9
The 2020 playbook was equally dramatic. From June 2020 through June 2021, the Russell 2000 returned approximately 52%, roughly 20 percentage points ahead of the S&P 500.
Small-caps are more sensitive to the “fear removal” catalyst because they carry higher equity risk premiums during drawdowns. When fear recedes, that premium gets repriced fastest in small-caps.
The Russell 2000 currently trades at approximately a 30% forward P/E discount to the S&P 500 — the widest in over 25 years, per Wedbush research.
If the breadth expansion pattern repeats, IWM has the most room to run over a 6-to-12-month window.
The Pullback Window Is Real, But Both Precedents Kept Climbing
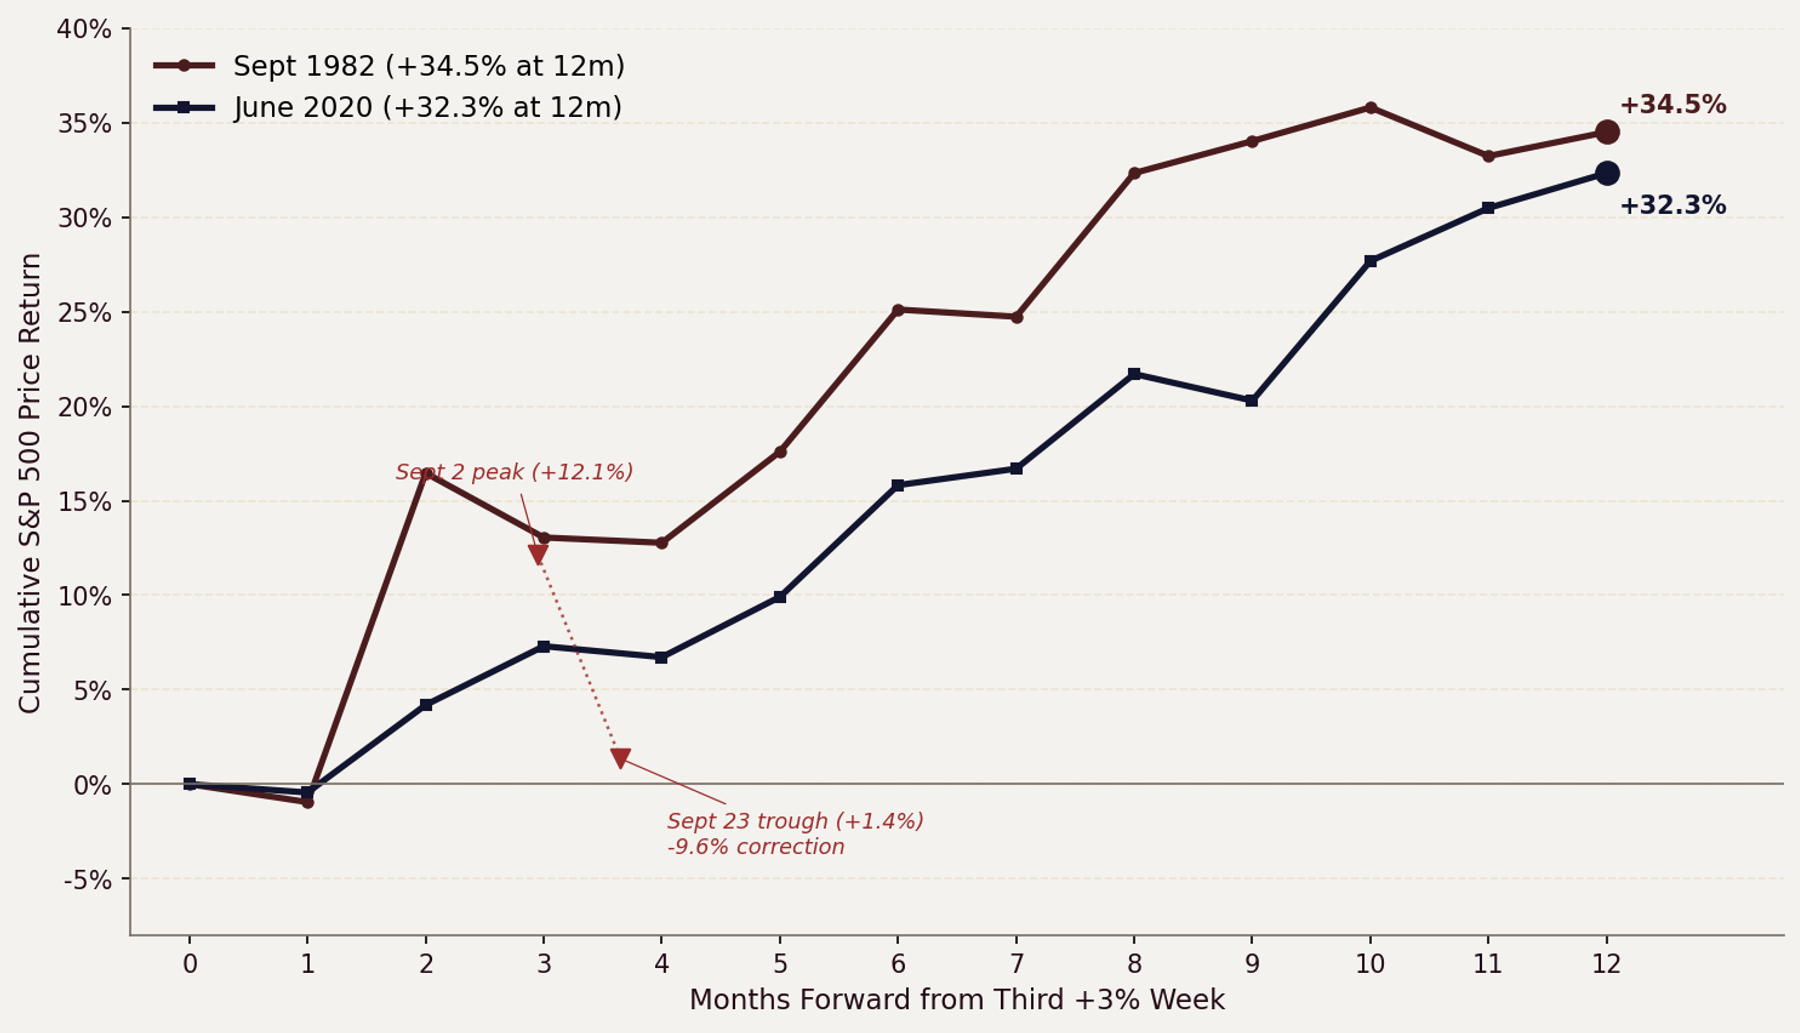
Source: S&P Dow Jones Indices, ^GSPC daily closes via OpenBB. Cumulative price returns at 13 monthly anchor points measured from end of third +3% weekly close. 2020 drawdown markers show Sept 2 peak (3,580.84) and Sept 23 trough (3,236.92), a −9.6% correction before resuming the uptrend.
The Counter-Argument
The most honest critique of this thesis is the sample size. Two prior instances across 76 years is not a statistically significant dataset.
No quant fund would size a position based on n=2, and the intellectual humility to acknowledge that matters.
Extrapolating a +33.4% forward return from two data points is not a model. It is a pattern observation with a very wide confidence interval.
The overbought readings are real and demand respect. The Nasdaq’s 13-day winning streak and the RSI’s oversold-to-overbought sprint in 11 trading days are historically extreme.
In 2020, the S&P pulled back approximately 9.6% in September after a similar overbought condition. A 5-to-8% drawdown from current levels would take the S&P back to roughly 6,600 to 6,770.
That kind of pullback is not just possible but probable within the next 60 days.
The Iran peace catalyst is fragile. Ceasefire hopes and the reopening of the Strait of Hormuz are reversible. If negotiations collapse, oil prices could spike again and the entire fear premium returns.
The S&P priced in relief. If relief turns out to be premature, the unwind will be aggressive.
Inflation remains sticky at 3.3% as measured by March CPI (OECD harmonized, 3.26% unrounded). The Federal Reserve has limited room to cut rates, and the Beige Book’s characterization of “slight to modest” growth does not inspire confidence in the earnings growth trajectory needed to justify all-time-high valuations.10
S&P 500 Q1 2026 blended earnings growth stands at +13.2% year-over-year as of April 17, 2026, according to FactSet Earnings Insight — but that figure is an early-season snapshot with only about 10% of the index reported, meaning roughly 90% of the number is still analyst estimate rather than actual result and is subject to revision as reporting progresses.
The expected number also leans heavily on a handful of mega-cap tech names, so the headline growth rate may not be representative of the broader index.
The structural difference between 2026 and the two prior instances also deserves attention.
In 1982, the rally launched from an S&P level of roughly 102, a starting valuation so depressed that the risk-reward was asymmetrically favorable. In 2020, the rally launched from a 34% drawdown, also deeply depressed. In 2026, the signal arrived with the S&P already at all-time highs. The risk-reward profile is mathematically different even if the signal is the same.
Any long position based on this pattern requires tight risk management. A close below the March 30 lows would invalidate the fear-reversal pattern and suggest the rally was a bear market bounce rather than the start of a sustained trend.
Key Data Comparison
| Metric | Sept 1982 | June 2020 | April 2026 |
|---|---|---|---|
| Three-Week Cumulative Gain | +18.1% | +11.5% | +11.9% |
| Catalyst | Volcker rate cuts | Fed QE + CARES Act | Iran peace deal hopes |
| S&P 500 vs. Prior ATH at Signal | −12.7% | −5.7% | New ATH (+2.1%) |
| 3-Month Forward Price Return | +13.1% | +7.3% | TBD |
| 6-Month Forward Price Return | +25.1% | +15.8% | TBD |
| 12-Month Forward Price Return | +34.5% | +32.3% | TBD |
| Max Drawdown in Next 6 Months | −7.1% | −9.6% | TBD |
| Subsequent Bull (low-to-peak) | 5 years (+229%) | 21 months (+114%) | TBD |
Returns shown are S&P 500 price returns calculated from ^GSPC daily closes. Total returns including reinvested dividends would add approximately 3-6 percentage points to the 1982 12-month figure and approximately 1-2 ppts to the 2020 12-month figure. Sept 1982 subsequent bull measured Aug 12, 1982 low to Aug 25, 1987 peak; June 2020 subsequent bull measured March 23, 2020 low to January 3, 2022 peak. Sources listed in endnotes.1,2,3,6,7
Catalyst Map
- April 21–25, 2026 Peak Q1 earnings week. Tesla (Apr 22), Intel (Apr 23), and 180+ S&P 500 names report. If aggregate guidance holds, the earnings floor under the rally solidifies.
- April 28–29, 2026 FOMC rate decision (statement and press conference Wed Apr 29). Fed expected to hold at 3.50–3.75% per CME FedWatch. Alphabet and Microsoft also report Q1 earnings this week.
- May 12, 2026 April CPI report (per BLS release schedule). If inflation stays at or below 3.3%, the Fed retains the option to cut in Q3. A surprise above 3.5% closes the rate-cut window.
- Late May 2026 Iran-US negotiations formal framework expected. A signed deal removes the geopolitical tail risk entirely.
- June 16–17, 2026 Next FOMC rate decision (SEP meeting). Market will be watching for any shift in dot-plot projections.
- June 2026 Russell 2000 annual rebalancing. Reconstitution adds fresh inflows to small-cap names, potentially accelerating the IWM catch-up trade.
- July 2026 Q2 earnings season. By this point, the 3-month forward window closes. Both 1982 and 2020 showed double-digit gains by month three (+13.1% and +7.3% respectively).
The Bottom Line
Three consecutive +3% weeks is the rarest momentum signal in modern market history, and both prior instances produced strong forward returns — an average of +10.2% at three months, +20.5% at six months, and +33.4% at twelve months on a price-return basis. A 5–8% pullback within 60 days is probable given extreme overbought conditions, but the weight of historical evidence favors staying long through any near-term volatility. The thesis breaks if Iran negotiations collapse or if Q1 earnings reveal that the rally has no fundamental floor beneath it.
Sources
1. S&P Dow Jones Indices weekly return data, 1950–2026, computed from ^GSPC daily closes via OpenBB MCP. Three consecutive +3% weekly returns identified in weeks ending Sept 3, 1982 (+8.83% / +3.62% / +4.76%, cumulative +18.15%); June 5, 2020 (+3.20% / +3.01% / +4.91%, cumulative +11.50%); and April 17, 2026 (+3.36% / +3.56% / +4.54%, cumulative +11.95%).
2. ^GSPC daily closes via OpenBB. S&P 500 bottom on August 12, 1982 at 102.42; close of 122.68 on September 3, 1982. Subsequent bull market high of 336.77 on August 25, 1987 = +228.8% over 5.03 years.
3. ^GSPC daily closes via OpenBB. February 19, 2020 close 3,386.15 to March 23, 2020 close 2,237.40 = −33.92% in exactly 23 trading days. 50-day rally from March 23 low to June 3, 2020 close 3,122.87 = +39.58%. Close of 3,193.93 on June 5, 2020. Subsequent bull market high of 4,796.56 on January 3, 2022 = +114.4% from March low over 21.4 months.
4. Finnhub market data, ^GSPC and SPY closes as of April 17, 2026. Reuters, CNBC reporting on Iran Strait of Hormuz developments, April 2026.
5. Dow Jones Market Data via MarketWatch, Nasdaq Composite winning streak history, April 17, 2026. Benzinga/CNBC, Nasdaq RSI calculations, April 15, 2026.
6. ^GSPC daily closes via OpenBB. Forward price returns from Sept 3, 1982 close of 122.68: to Dec 3, 1982 (138.69) = +13.05%; to March 3, 1983 (153.48) = +25.11%; to Sept 2, 1983 (165.00) = +34.50%. Total return with dividends reinvested is approximately 3-6 ppts higher at 12 months based on annualized ~5-6% dividend yield in 1982.
7. ^GSPC daily closes via OpenBB. Forward price returns from June 5, 2020 close of 3,193.93: to Sept 4, 2020 (3,426.96) = +7.30%; to Dec 4, 2020 (3,699.12) = +15.82%; to June 7, 2021 (4,226.52) = +32.33%. September 2020 correction: peak 3,580.84 on Sept 2, trough 3,236.92 on Sept 23 = −9.60%. Russell 2000 (^RUT) return June 5, 2020 (1,507.15) to June 7, 2021 (2,319.18) = +53.88%.
8. Finnhub, IWM quote $275.78 close April 17, 2026. IWM low $239.61 close on March 30, 2026.
9. Fama-French small-cap value factor data, Kenneth French Data Library, 1982–1983.
10. Federal Reserve Beige Book, April 15, 2026 (“slight to modest pace in 8 of 12 districts”). OECD Harmonized CPI via OpenBB, March 2026 +3.26% YoY. FactSet Earnings Insight, S&P 500 Q1 2026 blended earnings growth +13.2% YoY as of April 17, 2026 (10% of index reported).