ProCap Insights · April 28, 2026
Boomers aren’t leaving money to the kids. They’re spending it on these 2 stocks.
The great wealth transfer headline ranges from the widely-cited $84 trillion estimate to $124 trillion. Boomers are not handing intact estates down. They are spending the money on themselves, and 2 companies sit at the cash register before any of it ever reaches an heir.
What to Know
- Own Welltower (WELL) and LPL Financial (LPLA) as the pure-play pair on Boomer spend-down. WELL closed at $208.75 with 10 of 13 covering analysts at Buy or Strong Buy and zero sells; LPLA closed at $320.51 with 12 of 14 at Buy or Strong Buy, a $404.14 mean target, and 26% implied upside.2
- The supply-demand gap is the knockout number. Senior housing inventory growth ran below 1% in Q4 2025, while the industry faces a 550,000-unit national deficit by 2030; LPLA grew TTM revenue 37.2% versus 8.1% at Schwab and 5.9% at Raymond James.3
- The next two earnings reports are the catalyst that closes LPLA’s relative-value gap. LPLA trades at a 14.3x forward P/E in line with Schwab while growing roughly 5x faster, and the Q1 2026 print in early May puts Commonwealth integration progress and continued advisor recruiting wins in front of the market.2
WELL has tripled the S&P over two years. LPLA has lagged it. That gap is the second leg of the trade.
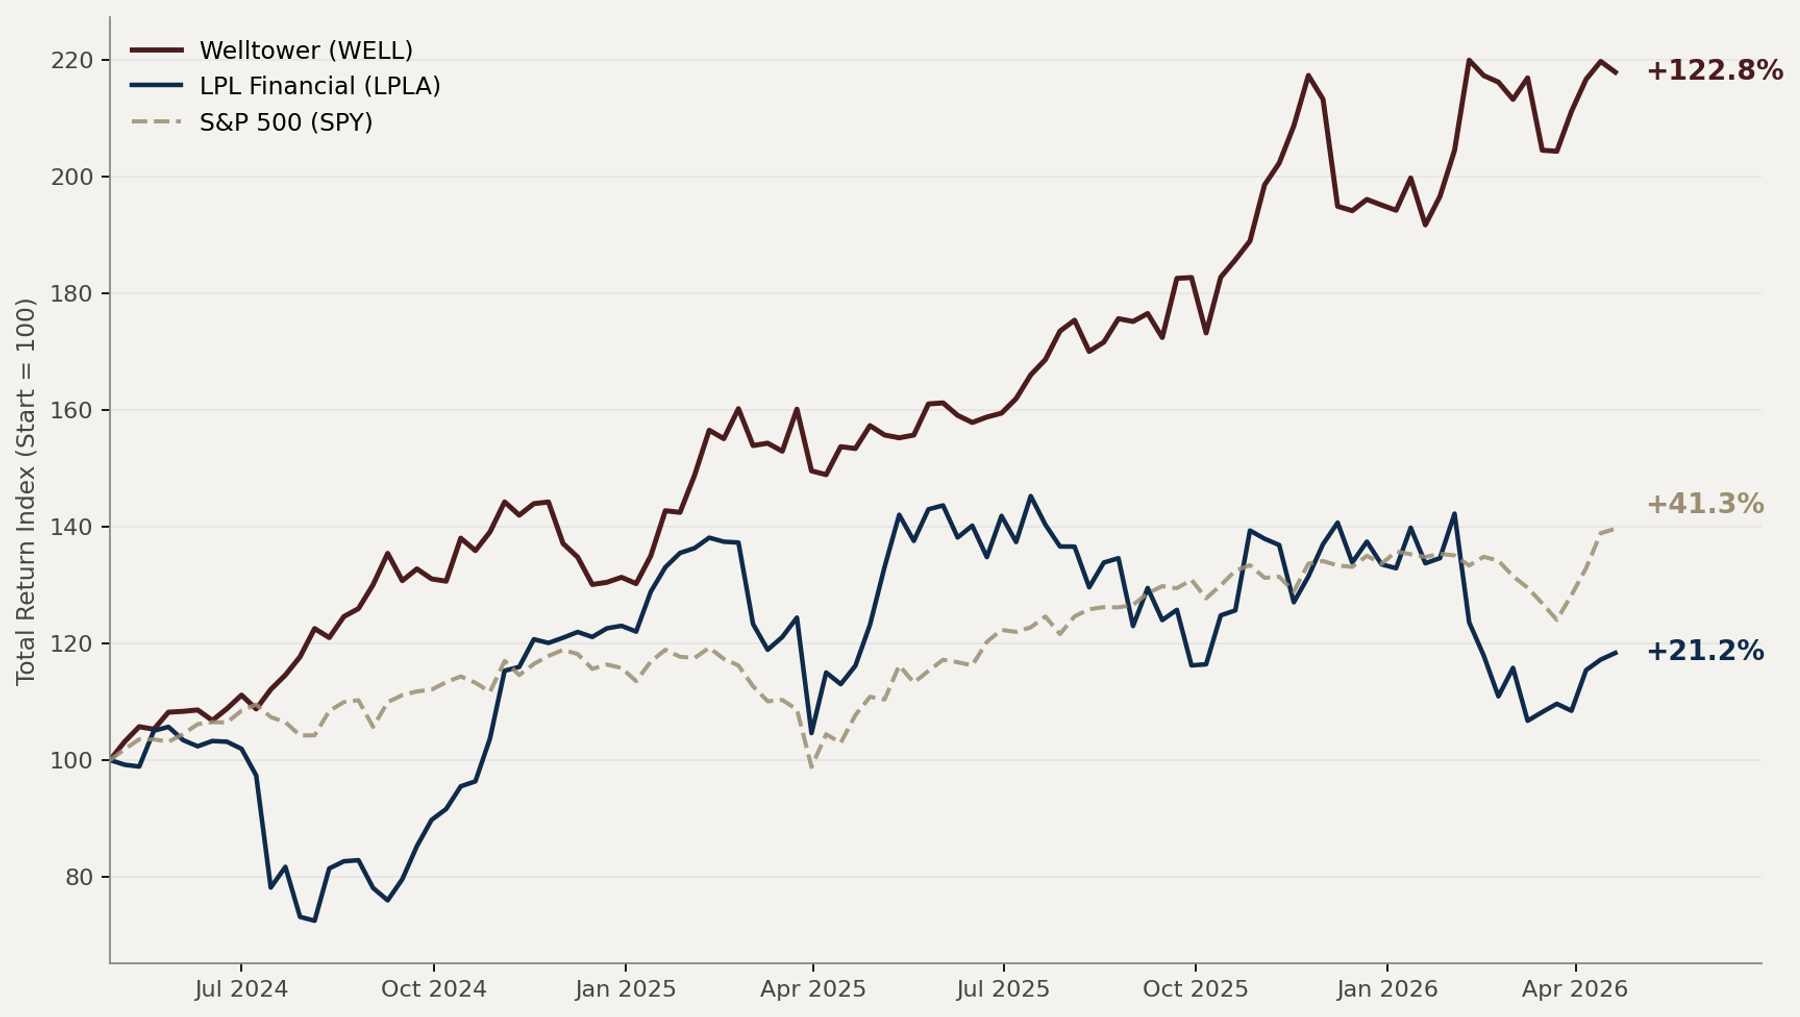
Daily close, April 24, 2024 to April 24, 2026; price returns only.⁴
The $84 Trillion Reframe and Why “Wealth Transfer” Is the Wrong Word
The 2018 estimate was $68 trillion over 25 years. The 2022 revision lifted that to $84.4 trillion through 2045 with $72.6 trillion to heirs, $11.9 trillion to charity.
The most recent 2024 revision lifts it again to $124 trillion through 2048 ($105 trillion to heirs, $18 trillion to charity), with the increase driven by dollar inflation and outsized growth in equity (+27%) and real estate (+39%) prices since the prior estimate.1
Federal Reserve household wealth data shows Boomers held $88.5 trillion in Q1 2025, providing the live stock against which all of these flow estimates anchor.1
The $84 trillion shorthand has stuck in the popular discourse, but the underlying point is the same regardless of which estimate you use.
The dollars do not move all at once and they do not move untouched.
Survey work finds 55% of Boomers do not expect to leave any inheritance at all, and 28% say leaving an inheritance is “not that important” or “not at all important.”5 Just 22% of Boomers and 22% of Gen X say they plan to leave a financial gift, while 32% of Millennials and 38% of Gen Z expect to receive one.5
The generational expectations gap is the leading indicator.
Households headed by someone 65 and older spend roughly a third of their budget on housing and a low-double-digit share on healthcare, which together account for close to half of total expenditures.6
That share rises further with age as out-of-pocket medical and long-term-care costs escalate.
The investable theme is not what heirs do with the money. It is what retirees buy on the way to the heirs, and a majority of Boomers are explicitly telling pollsters they intend to spend it down rather than pass it down.
That reframing knocks out the obvious tickers.
Cruise lines (RCL, CCL) capture leisure dollars but face younger-cohort competition and high cyclicality.
Luxury (LVMUY, EL) sells globally and is exposed to China consumer weakness, and funeral services (SCI) addresses only the end-of-life slice.
The two categories that scale linearly with longevity are rent on professionally managed housing and the management fee on financial assets.
The Watchlist
| Metric | Welltower (WELL) | LPL Financial (LPLA) |
|---|---|---|
| Price (Apr 24, 2026 close) | $208.75 | $320.51 |
| Market Cap | $146B | $25.7B |
| Forward Multiple | ~34x 2026 FFO | 14.3x forward EPS |
| Revenue Growth (TTM YoY) | +35.8% | +37.2% |
| Dividend Yield | 1.42% | 0.37% |
| Analyst Mean Target | $224.38 | $404.14 |
| Implied Upside | +7.5% | +26.1% |
| Buy / Strong Buy Ratings | 10 of 13 | 12 of 14 |
| Sell Ratings | 0 | 0 |
| 2-Year Price Return | +122.8% | +21.2% |
| S&P 500 same period | +41.3% | +41.3% |
Data as of April 24, 2026 close.2
The asymmetry sits in the comparison.
WELL has already captured most of the demographic re-rating and is the high-conviction, lower-multiple-of-upside way to own the trade.
LPLA has lagged the S&P by roughly 20 percentage points over two years despite higher revenue growth, leaving the larger forward upside on top of stronger near-term fundamentals.
Median Street targets ($230 for WELL, $383 for LPLA) imply +10.2% and +19.5%, modestly below the means but firmly positive in both cases.2
Pick #1. Welltower (WELL) Owns the Pipe Where Retiree Cash Flows
Welltower is the largest healthcare REIT in the United States and the dominant operator of senior housing under the RIDEA structure, which means the company captures operating upside rather than just collecting fixed rent.
The company reported 172,000 senior housing units as of June 30, 2025.7
The October 27, 2025 announcement disclosed $14 billion in pro-rata acquisitions across more than 700 senior housing communities and over 46,000 units in the UK, US, and Canada, including a $4 billion U.S. tranche covering roughly 12,000 units across 150 East Coast communities.8
Pro-forma for these closings, the senior housing portfolio scales to roughly 218,000 units, making it by a wide margin the largest pure-play rental platform aimed at the silver economy.
Senior housing occupancy across the 31 NIC primary markets reached 89.1% in Q4 2025, the 18th consecutive quarter of occupancy gains.3
Senior housing demand outpaces supply by roughly three-to-one through 2030.

Senior housing units needed by 2030 versus units in the current development pipeline.⁹
The supply side cannot respond. Senior housing construction starts in 2024 hit the lowest annual total since 2009, the depths of the global financial crisis, and the trend has continued into 2025.
The 2030 unit deficit cluster is roughly 550,000 units, and the closing of that gap requires a $275 billion investment shortfall to be filled.9
Net absorption substantially outpaced new supply for the year, producing the structurally tightest senior-housing market on record.
When demand grows by roughly 4% a year and inventory grows by roughly 1%, the price of the existing inventory does what economics dictates.
Same-store NOI growth in the senior housing operating portfolio has run double-digit for years.
The Q3 2025 Business Update reported 12 consecutive quarters of more than 20% same-store SHO NOI growth, with Q3 2025 itself printing 20.3% and Q4 2025 printing 20.4%.10
National median monthly rent runs roughly $3,200 for independent living and $5,419 for assisted living based on actual 2025 move-in data.11 State-level medians for IL range from roughly $2,250 (SD) to $5,650 (VT), and AL ranges from below $4,000 in low-cost states to over $11,000 in high-cost states.
Welltower’s portfolio skews to higher-end East Coast and UK markets and luxury communities (the Newbury of Brookline, Westchester County, Boston), so its IL/AL rent levels run materially above the national median.
That is a feature given the firm’s deliberate positioning toward affluent retirees less exposed to affordability risk.
Wall Street is positive. Ten of thirteen covering analysts rate WELL Buy or Strong Buy, zero are rated Sell, and the mean price target of $224.38 implies 7.5% upside from the April 24, 2026 close of $208.75.2
The argument against WELL is not absent. The stock trades at roughly 34x 2026 normalized FFO, using Welltower’s own FY2026 guidance midpoint of $6.17 per share (range $6.09 to $6.25, above prior consensus of approximately $6.02 to $6.03 before the February 10, 2026 print).12
That is well above the 10-year REIT sector average near 18x, and that premium is the entire counter-argument addressed below.
Pick #2. LPL Financial (LPLA) Is the Toll Road on the Transfer Itself
LPL Financial is the largest independent broker-dealer platform in the United States.
The firm supports approximately 32,000 financial advisors and custodies $2.41 trillion in brokerage and advisory assets across roughly 8 million Americans as of January 2026.13
Every dollar that moves out of a wirehouse advisor (Wells Fargo, Merrill Lynch, UBS) and into an independent practice on LPL’s platform pays LPL a fee on advisory assets, a sweep deposit spread on cash, and a margin on transactions.
Every dollar a Boomer client moves from a 401(k) into a managed rollover account on LPL pays the same fees.
Every dollar inherited by Gen X and millennial heirs that stays with the existing advisor pays the same fees, so LPL gets paid on motion regardless of direction.
LPL added three advisor teams managing a combined $485 million from Wells Fargo, Edward Jones, and Osaic in a single seven-day stretch in late March and early April 2026.14 The April 7, 2026 onboarding of Emerald Legacy Advisors alone moved $140 million from Wells Fargo Advisors Financial Network.15
The $2.7 billion all-cash acquisition of Commonwealth Financial Network closed on August 1, 2025 and brought approximately 3,000 additional advisors managing $305 billion onto the platform.16 LPL led the industry in net advisor gains in 2025 with 601, versus Raymond James (313), Schwab (117), and Morgan Stanley (88).17
Revenue grew 37.2% year-over-year on a trailing-twelve-month basis, with much of the acceleration in H2 2025 reflecting the Commonwealth integration; underlying organic growth runs at a roughly 10–12% pace.2 Return on equity sits at 18.6%.
The forward P/E of roughly 14.3x is essentially in line with Charles Schwab (~15x forward) and modestly above Raymond James (~13x forward).2 LPLA is growing top-line at 37.2% versus 8.1% at Schwab and 5.9% at Raymond James, roughly 5x Schwab’s growth rate and 6x Raymond James’.2
Investors are paying a Schwab multiple for materially faster organic-plus-deal growth and a structurally accelerating consolidation tailwind.
Schwab is a much more rate-sensitive business with higher revenue concentration in net interest income. Raymond James is structurally smaller and less of a consolidator.
The Street agrees. Twelve of fourteen covering analysts rate LPLA Buy or Strong Buy, zero are rated Sell, and the mean price target of $404.14 implies 26.1% upside from the April 24, 2026 close of $320.51. The high target sits at $500, implying 56% upside if the recruiting pace holds through 2027.
Note that several analysts cut targets in early April 2026, reducing the consensus from the $432 area earlier in the quarter.2
LPL has lagged the S&P 500 over two years (+21.2% versus +41.3% price return) despite outgrowing it on every fundamental metric, and that gap is the second-leg setup.
Why These Two and Not the Obvious Picks
The thematic pitch typically points to luxury hospitality (Marriott, Hyatt, Royal Caribbean), high-end consumer (Estée Lauder, LVMH, Costco), or healthcare facilities (HCA, UnitedHealth, Tenet). Each fails one of three filters.
Filter 1. Demographic exclusivity.
Cruise lines and luxury retail address a global customer base where Boomer demand is one of many drivers. WELL and LPLA address customer cohorts where Boomers and their immediate heirs are essentially the entire end market.
Filter 2. Supply-side discipline.
Hotels and cruise capacity expand when capital is available. Senior housing supply is structurally constrained by zoning, financing, and labor, while wealth-management distribution is consolidating rather than expanding. WELL and LPLA sit on supply curves that are inelastic to demand.
Filter 3. Recurring revenue capture.
A cruise booking is one transaction. A senior housing lease pays monthly for an extended stay (median 22-month stay for assisted living, with longer averages for independent living) at $5,000 to $7,000-plus per month in higher-end portfolios.18
An advisory account pays a quarterly fee on assets that compound. The lifetime value math favors WELL and LPLA by an order of magnitude over the lifestyle alternatives.
The Consensus and Where It Breaks
Wall Street’s consensus framing of the wealth transfer is “watch where the heirs invest.” That framing is roughly a decade early.
The bulk of the dollars move between 2030 and 2045, and survey work shows the holders of those dollars have other plans for them in the meantime.1,5
The consensus also treats the theme as a consumer story, which sends portfolios toward cruise lines, luxury, and wellness. The data points elsewhere. Consumer-expenditure tables, occupancy data, and recruiting prints all rhyme on the same point.
Boomer dollars are flowing into housing, healthcare, and professionally managed financial assets at a rate the supply side cannot match.6 The repricing happens at the cash register, not at the inheritance.
Where consensus breaks is the relative-value setup inside the trade itself. WELL is the consensus winner of the senior-housing repricing and is priced accordingly, with most sell-side commentary treating its 34x forward FFO as already capturing the demographic tailwind.
LPLA is treated as an aggregator stock rather than a wealth-transfer stock, and its forward P/E sits in line with Schwab’s despite materially faster growth and a structurally accelerating consolidation cycle.
The market has not connected LPL’s 601 net advisor gains in 2025 (versus 117 at Schwab) to the wealth-transfer thesis.17 Once it does, the multiple gap closes.
The Counter-Argument
The strongest case against this pair is interest-rate sensitivity.
WELL trades at a premium FFO multiple that has historically compressed when 10-year Treasury yields rise above 4.5%, and LPLA earns roughly a fifth of revenue from sweep deposit spreads that reset with the federal funds rate.
A scenario where the Fed holds rates higher for longer to combat sticky services inflation would pressure both names through different mechanisms.
WELL’s cap rates would widen, and LPLA’s sweep spread would shrink as the rate path bends.
For WELL specifically, the 34x forward FFO multiple bakes in continued double-digit same-store NOI growth and high-90s occupancy. If labor inflation in skilled-nursing and assisted-living staffing accelerates, NOI growth compresses, and the multiple becomes harder to defend.
Q3 2025 actual-rates data shows IL initial-rate growth running 7.6% YoY (slowed from 17.5% in June 2025), and same-store asking-rent growth of 4.4% for AL and 4.2% for IL.
Pricing power is still well above general inflation, but the deceleration points to an affordability ceiling for middle-income retirees that is approaching.3 The “forgotten middle” literature projects that roughly half of middle-income seniors will be priced out of traditional senior living by the end of the decade.19 WELL’s deliberate high-end positioning insulates it, but the addressable market narrows in the bear case.
For LPLA, the bear case is platform competition. Larger custodians and competing broker-dealers have remained aggressive on advisory pricing and platform economics, and industry recruiting deals at competitors such as Raymond James, Ameriprise, and Osaic have continued to escalate transition-assistance bonuses through 2025 and 2026.
If transition-assistance bonuses keep climbing, LPL’s recruiting math gets uglier. The other concern is the Commonwealth integration, where moving 3,000 advisors onto a new platform is operationally expensive, and any sizeable attrition during the transition reduces the deal economics LPL is paying for.
Press coverage in early 2026 has tracked individual Commonwealth-team departures to RIA platforms. None has been individually material, but the trend is worth monitoring.20
There is also a generational risk that applies to both names. High-net-worth research shows roughly seven in ten Gen X and millennial heirs change financial advisors after inheriting (industry estimates commonly cite figures in the 70%-plus range, though specific methodologies vary).1
If LPL cannot retain the next generation of clients on the platform, the wealth-transfer thesis gets re-routed to RIAs the heirs already use. Welltower faces an analogous issue if Boomer children, who watched their parents pay several thousand dollars per month for assisted living, decide to age in place via at-home care services rather than move into facilities.
These risks are real, and they are also priced.
Both stocks trade at multiples below their pre-pandemic peaks on operating metrics, and the thesis does not require everything to go right. It requires the supply gap to persist for three to five more years and the advisor-recruiting cycle to continue at a normal pace, both of which are supported by current data.
The Bottom Line
Welltower is the high-conviction, lower-volatility expression of the trade and the data already proves the thesis with occupancy at multi-year highs and 10 of 13 covering analysts at Buy or Strong Buy. LPLA is the higher-upside expression, with 26% mean analyst upside reflecting a market that has not yet priced LPLA’s 14.3x forward P/E at parity with Schwab against revenue growth running 5x faster. The Q1 2026 prints in early May, covering Welltower’s SHO NOI growth and LPL’s Commonwealth integration and net advisor adds, are the catalyst window that closes the relative-value gap.
Important disclosures. ProCap Insights is a research division of ProCap Financial. This report is for informational purposes only and is intended for the recipient’s personal use. It is not an offer to sell or a solicitation of an offer to buy any security and does not constitute investment, legal, tax, or accounting advice. Investing involves risk. Do your own research.
Forward-looking statements. This report contains forward-looking statements regarding company fundamentals, sector dynamics, interest rates, and other economic variables. Such statements are based on assumptions believed to be reasonable but are subject to significant business, economic, and competitive uncertainties. Actual results may differ materially. Past performance is not indicative of future results, and there is no assurance that any forecast, target, or projection will be realized. Investments in equity securities, including REITs and broker-dealers, involve risk of loss of principal.
Sources and data. Pricing, fundamental, and consensus-estimate data are drawn from third-party providers including Financial Modeling Prep, Yahoo Finance, OpenBB, StockAnalysis.com, TipRanks, and MarketBeat. Industry data are drawn from primary research releases by NIC MAP Vision, NIC, A Place for Mom, Cerulli Associates, Northwestern Mutual, the Bureau of Labor Statistics, the Federal Reserve, Knight Frank, UBS, McKinsey, BCG, and the named issuers themselves. ProCap Insights makes no representation as to the accuracy or completeness of third-party data and accepts no liability for errors or omissions in such data.
Sources & Notes
Sources & Notes
Cerulli Associates wealth-transfer estimate lineage, verified directly from Cerulli press releases: (a) Original $68T / 25-year estimate published November 2018 (ThinkAdvisor and CNBC coverage, Nov 20, 2018; breakdown ~$60T to heirs, $8T to charity). (b) $84.4T update released by Cerulli on January 20, 2022, sourced from "U.S. High-Net-Worth and Ultra-High-Net-Worth Markets 2021" — through 2045, $72.6T to heirs and $11.9T to charity. (c) Most recent update released by Cerulli on December 5, 2024, sourced from "U.S. High-Net-Worth and Ultra-High-Net-Worth Markets 2024" — $124T through 2048, $105T to heirs and $18T to charity. Cerulli attributes the increase to dollar inflation, equity-price growth (+27%), and real-estate price growth (+39%) since the prior estimate. Independent cross-check. Cerulli’s estimates are corroborated by overlapping but methodologically distinct estimates from other research firms. Knight Frank Wealth Report 2024 projects $90 trillion in U.S. assets transferred through 2044 (through 2044, Silent Generation and Boomers combined). UBS Global Wealth Report 2025 estimates $83 trillion globally over 20–25 years, with $29 trillion of that in the U.S. and $74 trillion vertical / $9 trillion horizontal. McKinsey 2025/26 sees $22 trillion of direct U.S. inheritance over the next 10 years ($14T to Gen X, $8T to Millennials). Coldwell Banker Global Luxury 2026 puts the global 10-year transfer at $38.3 trillion including $4.6 trillion of real estate. Bank of America’s $129 trillion 2023 figure measures a different concept (government policy-driven wealth accumulation by Boomers over the prior 40 years, not bequests). The Federal Reserve Survey of Consumer Finances (Q1 2025) reports Boomers hold $88.5 trillion in current household wealth, which is the live stock against which all transfer projections are normalized. The $84 trillion / $124 trillion Cerulli estimates are well within the range implied by these independent analyses.
Tier-0 prices and fundamentals from Financial Modeling Prep / OpenBB and Yahoo Finance, pulled April 27, 2026 against the April 24, 2026 NYSE close (WELL $208.75, LPLA $320.51). WELL forward P/FFO = $208.75 / $6.17 (FY2026 normalized FFO midpoint) = 33.83x; LPLA forward P/E = $320.51 / $22.48 (FY2026 consensus EPS) = 14.26x; Schwab forward P/E = $90.85 / $6.02 = 15.09x; Raymond James forward P/E = $154.32 / $11.86 = 13.01x. Analyst-consensus figures triangulated from StockAnalysis.com (live, April 27, 2026), TipRanks, MarketBeat, and OpenBB-Yahoo. WELL: 13 covering analysts, mean $224.38, median $230, high $245, low $196, 10 Buy/Strong Buy, 3 Hold, 0 Sell. LPLA: 14 covering analysts, mean $404.14, median $383, high $500, low $350, 12 Buy/Strong Buy, 2 Hold, 0 Sell. Several LPLA targets were cut in early April 2026 (Morgan Stanley to $374, Barclays to $369, UBS to $380, Jefferies to $383); the consensus had been near $432 earlier in the quarter.
NIC MAP Vision, Q4 2025 release (occupancy 89.1%; 18th consecutive quarter of gains; inventory growth below 1% for three consecutive quarters); NIC blog “Independent Living Occupancy Rate Tops 90% in 3Q” (Q3 2025 IL initial-rate growth 7.6% YoY in September 2025, down from 17.5% in June 2025); NIC Q3 2025 release on same-store asking-rent growth (assisted living +4.4%, independent living +4.2%). NIC, January 2026 press release on 2025 occupancy. Schwab and Raymond James TTM revenue growth computed from FMP quarterly income statements (calendar TTM as of March 31, 2026).
Financial Modeling Prep historical-price endpoint via OpenBB, weekly closes from April 24, 2024 to April 24, 2026. Endpoint returns: WELL $93.70 to $208.75 = +122.78%; LPLA $264.54 to $320.51 = +21.16%; SPY $505.41 to $713.94 = +41.26%.
Northwestern Mutual, 2024 Planning & Progress Study (August 6, 2024 release, “As $90 Trillion Great Wealth Transfer Approaches, Just 1 in 4 Americans Expect to Leave an Inheritance”). Verified directly: 55% of Boomers+ answer “No” to whether they expect to leave an inheritance or charitable gift (vs 22% Yes, 23% Not sure); on the importance question, 14% of Boomers+ say leaving an inheritance is “not that important” and 14% say “not at all important” (combined 28%). Generational expectations: 22% of Gen X and 22% of Boomers+ plan to leave a financial gift; 32% of Millennials and 38% of Gen Z (where the question is “Yes” on receiving) expect one. Cross-checked against the Northwestern Mutual 2025 Planning & Progress Study.
U.S. Bureau of Labor Statistics, Consumer Expenditure Survey, 2024 annual data (Tables by age of reference person). Average household allocates 33.4% to housing and 7.9% to healthcare; the 65+ cohort allocates a higher share of the budget to healthcare than the average.
Welltower Inc., Q2 2025 fixed-income presentation, June 30, 2025 portfolio snapshot.
Welltower Inc., October 27, 2025 press release: “Welltower Announces $23 Billion of Transactions and Intensified Focus on Seniors Housing.” The headline figure is $23B in total transactions, comprising $14B of senior-housing acquisitions, $4B of additional U.S. assets within the $14B, and $9B of asset sales/loan repayments funding the deals.
NIC MAP Vision, “Topic Brief: A $275 Billion Investment Gap is Developing Between Now and 2030” (June 2024); BusinessWire, “Go long in senior housing: NIC MAP Vision data reveals a $275 billion investment shortage,” June 26, 2024. Cushman & Wakefield Senior Housing Outlook 2026.
Welltower Inc., Q3 2025 Business Update and earnings release, October 27, 2025 (Q3 SHO same-store NOI growth 20.3%); Welltower Inc., Q4 2025 earnings release, February 10, 2026 (Q4 SHO same-store NOI growth 20.4%; full-year normalized FFO $5.29).
A Place for Mom, 2026 Costs of Long-Term Care report (released February 19, 2026). Median monthly figures based on actual 2025 move-in costs.
Welltower Inc., Q4 2025 press release, February 10, 2026 (FY2026 normalized FFO guidance $6.09 to $6.25, midpoint $6.17). LSEG and Zacks consensus prior to print.
LPL Financial Holdings, January 2026 monthly metrics release (February 19, 2026); LPL Q4 2025 earnings materials (February 5, 2026).
AltsWire, April 13, 2026 reporting on LPL recruiting from Wells Fargo, Edward Jones, and Osaic in late March and early April 2026.
LPL Financial press release, April 7, 2026: “LPL Welcomes Emerald Legacy Advisors” (Kansas City, MO; $140M from Wells Fargo Advisors Financial Network).
LPL Financial press release, August 1, 2025: “LPL Financial Closes Its Acquisition of Commonwealth Financial Network” ($2.7B cash purchase price; ~3,000 advisors; $305B in assets).
Wolfe Research advisor-headcount data carried by InvestmentNews, January 28, 2026: “LPL, Raymond James, big winners in advisor recruiting in 2025.”
National Center for Assisted Living (NCAL) length-of-stay data; industry research compiled by NIC MAP Vision and A Place for Mom.
NORC at the University of Chicago, “The Forgotten Middle” (2019), reproduced in subsequent Cushman & Wakefield and AARP publications.
WealthManagement.com, “LPL Loses 328 Advisors After Commonwealth Deal” (April 2026); Financial Planning, advisor moves coverage of select Commonwealth-team RIA transitions, Q1 2026.